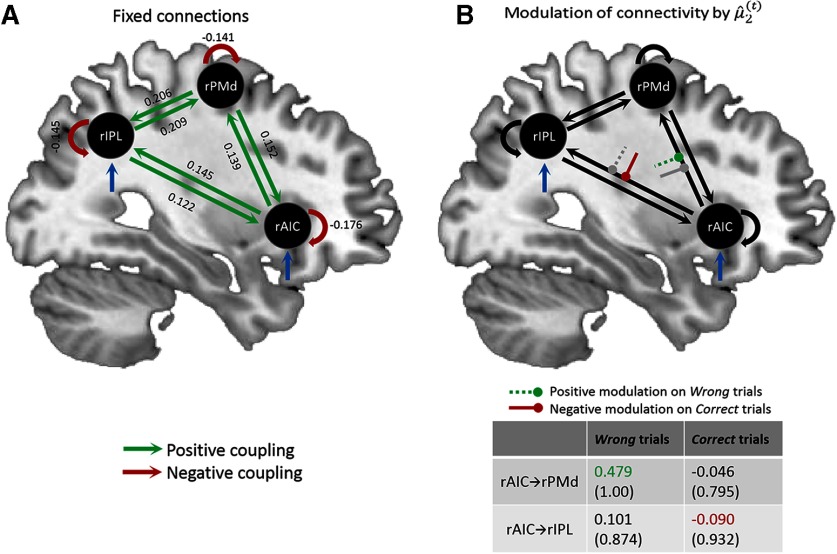
Figure 5.
Bayesian parameter averaging across participants for the winning DCM model 8 (Fig. 4). A, Endogenous (fixed) connections. Green connections = significant positive coupling rates, red connections = significant negative coupling rates. The numbers alongside the connections indicate coupling parameters representing the strength of effective connectivity in Hz. All fixed connections were significant (posterior probability = 1.00). Blue arrows represent the driving inputs. B, Modulation of connectivity by prior belief. Bayesian parameter averaging revealed that prior belief positively modulated the connection rAIC → rPMd for unexpected targets (green dashed line). For expected targets, prior belief negatively modulated the connection rAIC → rIPL (red solid line). The corresponding gray lines represent the nonsignificant modulation effects. The table depicts the Bayesian parameter averages with posterior probabilities in brackets for the modulation of connections by prior belief the modulation of connections by prior belief.

