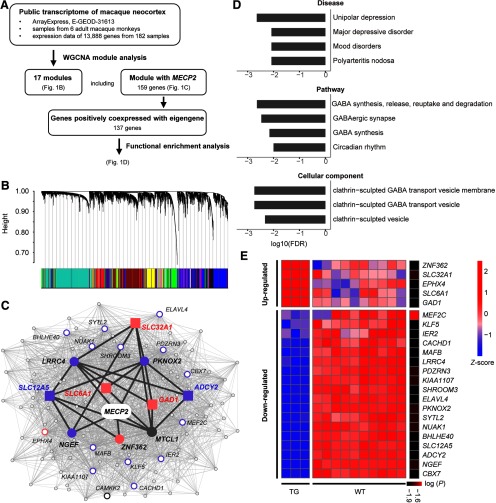
Figure 1.
WGCNA and functional enrichment analysis of MECP2-coexpressed genes. A, Overview of the weighted gene coexpression network analysis using public transcriptional data of 182 macaque cortical samples, and functional enrichment analysis on identified gene module coexpressed with MECP2. B, Network analysis dendrograms representing assignment of 13,888 genes to 17 modules. C, MECP2 coexpression network. Filled circles and squares indicate directed neighbors of MECP2 (n = 5) and genes enriched in GABA-related pathways (n = 5), respectively. All other second-order neighbors of MECP2 are represented with empty circles, where larger circles indicate the top 20 genes with larger node degree. Pink and purple colors indicate upregulation and downregulation in MECP2 transgenic monkeys, respectively. Dark gray lines indicate the path from MECP2 to GABA-associated genes. D, Mood disorders, four gene pathways, and three cellular components are significantly enriched in constrained genes (FDR-corrected, p < 0.01). E, Heatmap for the expression of MECP2-correlated genes in the cortical regions of MECP2 transgenic monkeys. Significant level [log (p)] is indicated in the sidebar. Red and blue colors indicate high and low expression, respectively.

