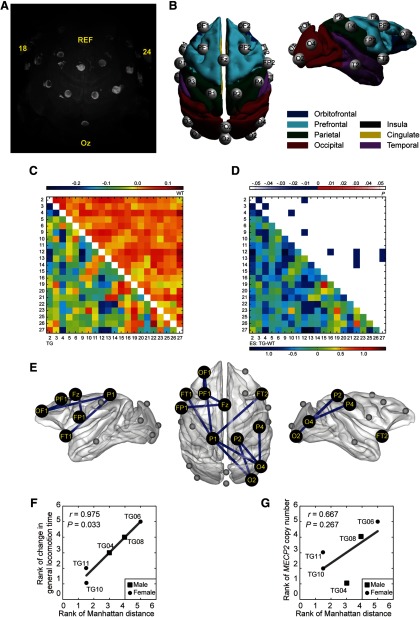
Figure 3.
Decreased β (12–30 Hz) synchronization in fronto-parieto-occipital networks in TG monkeys. A, Three-dimensional reconstruction of monkey TG04 wearing the EEG cap based on T2-weighted MRI images. Bright circles indicate electrode rings. Bright ellipses above circles indicate marked electrodes, including the reference (REF), most posterior (Oz), and most lateral (18/24) electrodes. B, Spatial organization of 21 active electrodes after mapping to the cortical surfaces of the F99 template brain. The electrodes were named after spatial location. C, Averaged covariate-free neural synchronization networks of TG (bottom left) and WT (top right) monkeys. The numbers indicate the electrode ID. The color bar denotes the logarithm of dwPLI. D, ESs (bottom left) and p values (top right) of the statistical comparison between TG and WT groups. Eleven connections widely distributed in fronto-parieto-occipital networks were identified significantly decreased in TG monkeys (edgewise, p < 0.005; cluster-level corrected, p = 0.010). E, Topographic distribution of abnormal connections was illustrated in the F99 template brain. F, G, Association of the overall abnormality in β-synchronization (Manhattan distance) with general locomotion time change after peer separation (F) and MECP2 copy number (G). Associations were evaluated via Spearman's rank correlation for TG monkeys only.

