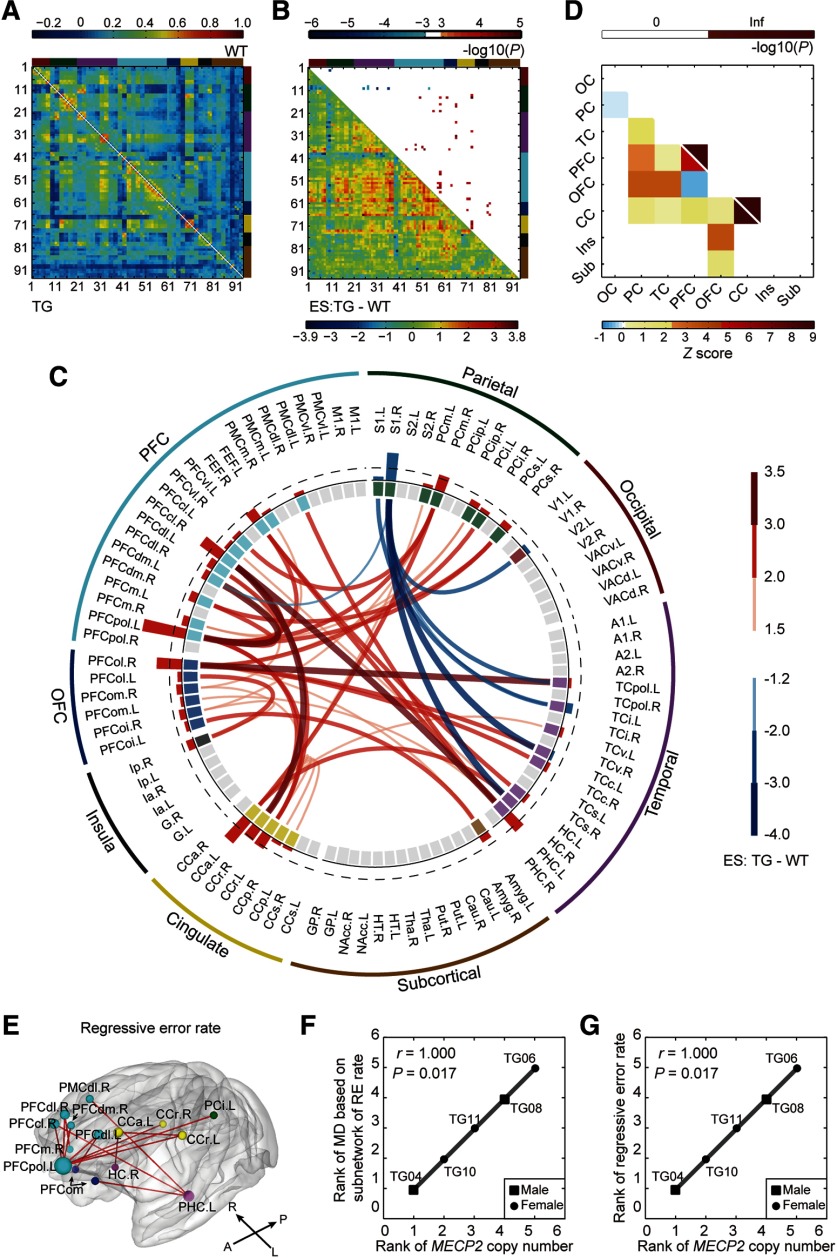
Figure 4.
Disrupted neural circuits in transgenic monkeys. A, Covariate-free connectivity network matrices for TG (bottom-left) and WT (top-right) monkeys. B, ESs of TG versus WT (bottom-left) are shown with corresponding p values (top-right; cluster-level corrected, p < 0.05; edgewise, p < 0.001). Brain nodes are sorted and organized according to the regions/lobes. C, Disrupted functional connections and brain nodes in TG monkeys. Red and blue bars in the interlayer indicate positive and negative ESn values, respectively. The dashed line labels the top 25% of absolute ESn values. D, Spatial distribution of disrupted connections across the brain (bottom left) and corresponding statistical significances (top right; p < 0.05, Bonferroni correction). Inf, Infinite; OC, occipital cortex; PC, parietal cortex; CC, cingulate cortex; Ins, insula; Sub, subcortical areas. E, Subnetworks associated with regressive error rates in the reversal learning task (p < 0.05, corrected). F, Gene–circuit association between MECP2 copy number and circuit abnormality. RE, Regressive error. G, Gene–behavior association between MECP2 copy number and regressive error behavior. Associations were evaluated via Spearman's rank correlation for TG monkeys only.

