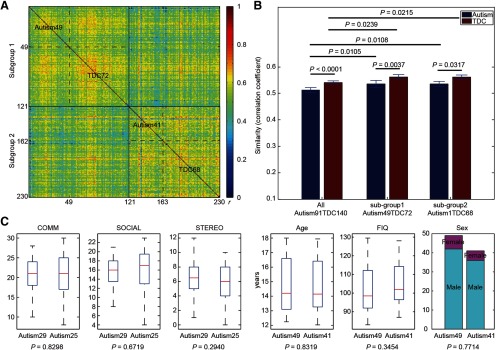
Figure 5.
Subject stratification based on functional connectivity patterns. A, An interindividual network similarity matrix of 230 participants clustered by a community detection algorithm. Two subgroups or clusters were derived out of this cohort, one with 49 individuals with autism and 72 TDCs (subgroup 1), and another with 41 individuals with autism and 68 TDCs (subgroup 2). Each row represents the similarities between the brain network of a single subject and that of all other subjects. Color bar, Pearson's correlation coefficients (r). B, Group comparison of interindividual network similarity. Brain network similarities of TDCs are always significantly higher than those of autism for both the entire cohort and two subgroups (10,000 times of permutation test). Brain network similarities of subgroups are significantly higher than those of the autism and TDC groups, respectively (10,000 times of permutation test). Error bars, SD. C, Comparisons of demographic information and clinical scores of human autism between subgroup 1 and subgroup 2. Note that clinical scores are only available for some patients in both subgroups (29 and 25 for subgroup 1 and 2, respectively). In the boxplot, the central mark is the median, and the edges of the box are the 25th and 75th percentiles. The whiskers extend to the most extreme data points. COMM, Communication total subscore of the classic ADOS; SOCIAL, social total score of the classic ADOS; STEREO, stereotypic behaviors and restricted interests total subscore of the classic ADOS.

