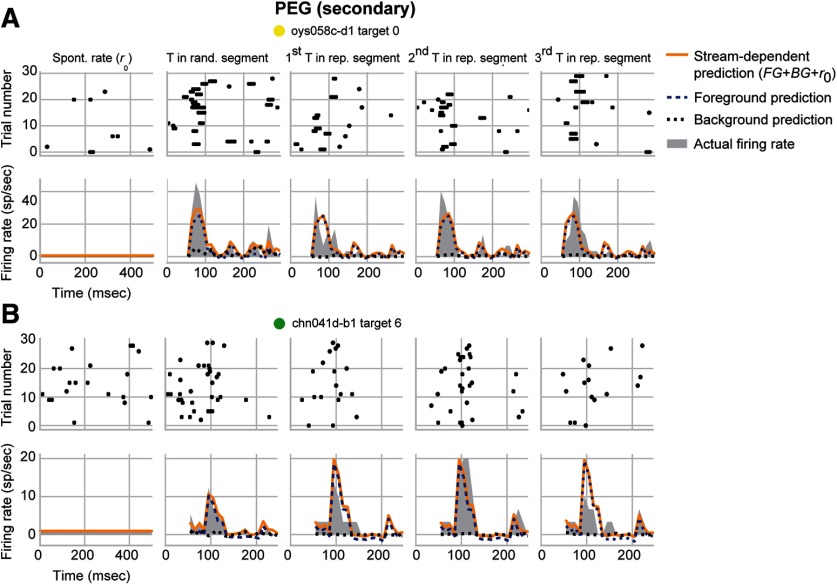
Figure 5.
Example PEG units showing foreground enhancement of responses to repeating noise. A, Raster and PSTH data for a unit from PEG, plotted as in Figure 4. This unit had a smaller overall response to the repeating segment compared with the random segment ( = −0.493; = −0.250), indicating some neural adaptation. Despite this adaptation, this unit had a significant foreground enhancement (E = 1.308) due to the suppression of background (= −1.316) but no change of foreground ( = −0.009). B, Same as in A for a second unit in PEG. This unit showed facilitation of the overall response ( = 0.425; = 0.104). When broken down by stream, a second PEG unit underwent foreground enhancement (E = 2.163) due to the suppression of background ( = −1.551) and the enhancement of foreground (= 0.612). Colored dots near each unit name identify their points in Figure 6.

