
Figure 1.
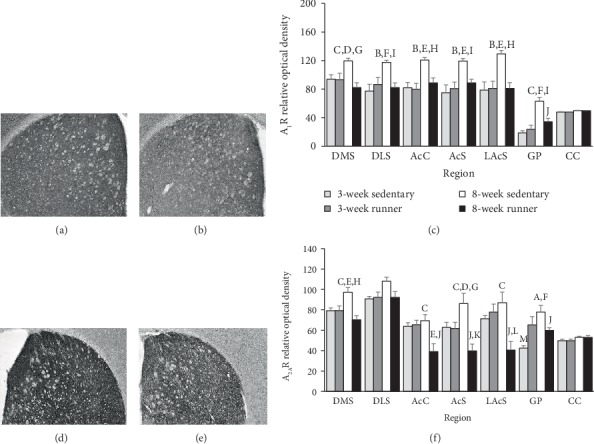
Striatal A1R and A2AR protein expression following three or eight weeks of wheel running. Representative immunohistochemistry images for A1R in the mouse striatum following eight weeks of (a) sedentary conditions and (b) running wheel access. (c) Relative levels of A1R protein density represented as averages across sections as detailed in the Methods. Representative immunohistochemistry images for A2AR in the mouse striatum following eight weeks of (d) sedentary conditions and (e) running wheel access. (f) Relative levels of A2AR protein density represented as averages across sections as detailed in Methods. Statistical significance denoted as follows: sedentary 8 weeks vs. runner 8 weeks at Ap < 0.05, Bp < 0.01, and Cp < 0.001. Sedentary 8 weeks vs. runner 3 weeks at Dp < 0.05, Ep < 0.01, and Fp < 0.001. Sedentary 8 weeks vs. sedentary 3 weeks at Gp < 0.05, Hp < 0.01, and Ip < 0.001. Runner 8 weeks vs. sedentary 3 weeks at Jp < 0.05. Runner 8 weeks vs. runner 3 weeks at Kp < 0.05 and Lp < 0.01. Sedentary 3 weeks vs. runner 3 weeks at Mp < 0.05.