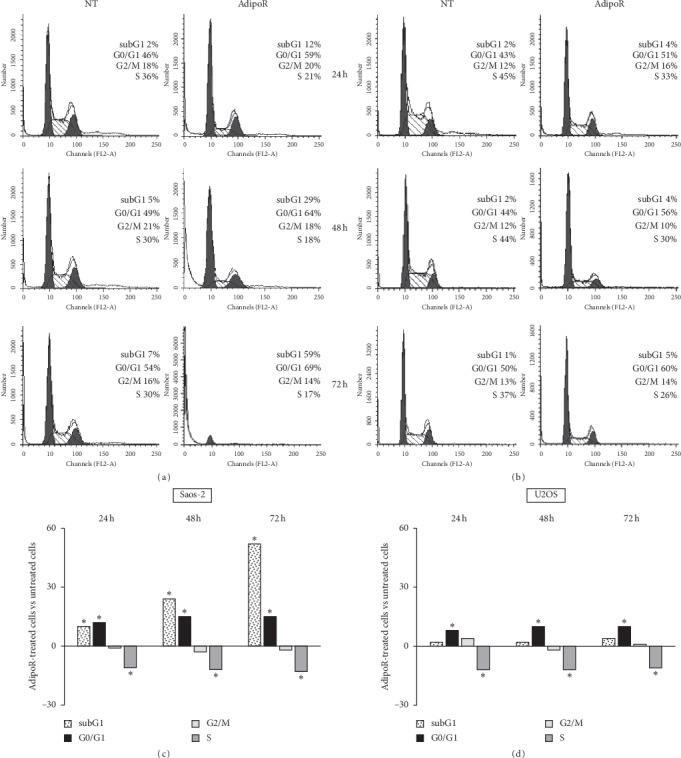
Figure 3.

Effects of AdipoR treatment on the cell cycle distribution and subG1 phases in Saos-2 and U2OS cells. Saos-2 (a and c) and U2OS (b and d) were exposed to 20 μg/mL of AdipoR for a time of 24, 48 and 72 h, and thereafter FACS analysis of PI-stained cells was performed. Representative FACS histograms of Saos-2 (a) and U2OS (b) cells exposed or not (NT) to AdipoR treatment were shown. Quantitative analyses of subG1, G1, S and G2/M percentage obtained from independent experiments performed in Saos-2 (c) and U2OS (d) were reported. Mean difference between AdipoR-treated cells and untreated cells has been used to chart the data. ∗P < 0.05 by unpaired t-test.
