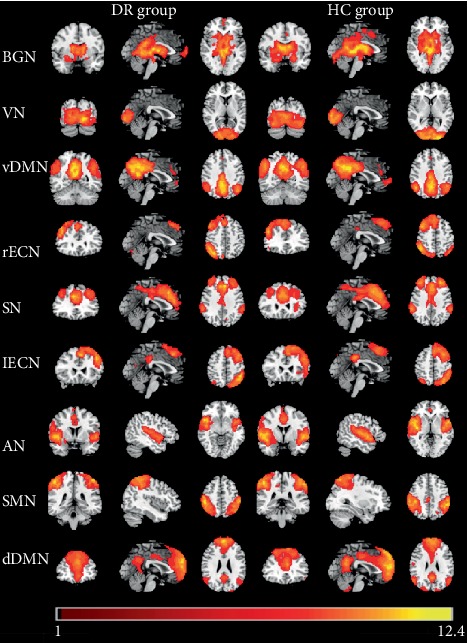
Figure 1.

The typical spatial patterns in each RSN of both DR and HC groups, including BGN, VN, vDMN, rECN, SN, lECN, AN, SMN, and dDMN. Scale represents t values with a range of 1~12.4 in each RSN (P < 0.001, FDR corrected). Abbreviations: DR: diabetic retinopathy; HC: healthy control; BGN: basal ganglia network; VN: visual network; vDMN: ventral default mode network; rECN: right executive control network; SN: salience network; lECN: left executive control network; AN: auditory network; SMN: sensorimotor network; dDMN: dorsal default mode network; RSN: resting-state networks; FDR: false discovery rate.
