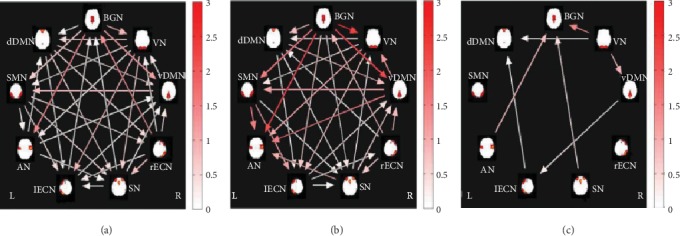
Figure 3.

Images show group FNC of RSN obtained by using the one-sample t-test in patients with DR (a) and HC (b). Significant different FNCs of RSN between patients with DR and HC using two-sample t-test. (c) The color bars represent time lag (0–3 s). Arrows represented a significant correlation between RSNs (P < 0.05, uncorrected); FNC analysis showed the increased functional network connectivity between VN-BGN, VN-vDMN, VN-dDMN, vDMN-lECN, SN-BGN, lECN-dDMN, and AN-BGN in the DR group relative to the HC group. Abbreviations: DR: diabetic retinopathy; HC: healthy control; BGN: basal ganglia network; VN: visual network; vDMN: ventral default mode network; rECN: right executive control network; SN: salience network; lECN: left executive control network; AN: auditory network; dDMN: dorsal default mode network; FNC: functional network connectivity; RSN: resting-state networks; L: left; R: right.
