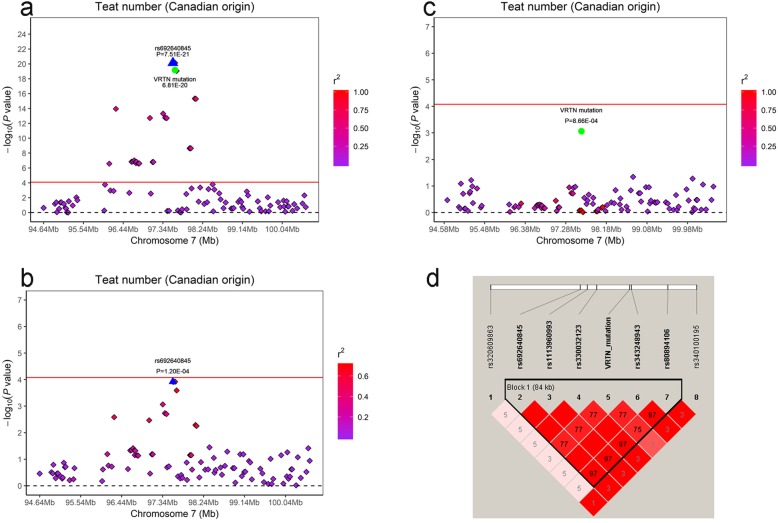
Fig. 6.
Regional plots of VRTN mutation and rs692640845 at 97.48–97.69 Mb on SSC7 for teat number in Canadian Duroc pigs. For a-c, the -log10(P-values) of SNPs (y-axis) are presented according to their chromosomal position (x-axis). The peak SNP of GWAS is denoted by large blue triangles. The VRTN mutation is denoted by green dot. Other SNPs are represented by colored rhombi according to the target SNP with which they were in strongest LD. The plots of a and b shows the association results for teat number before and after conditional analysis on VRTN mutation. The plots of a and c shows the association results for teat number before and after conditional analysis on rs692640845. d represents the 84 kb LD block in the significant region on SSC7 (97.48–97.69 Mb). The complete red boxes with no numbers indicated that SNP pairs have complete linkage disequilibrium

