Figure 2.

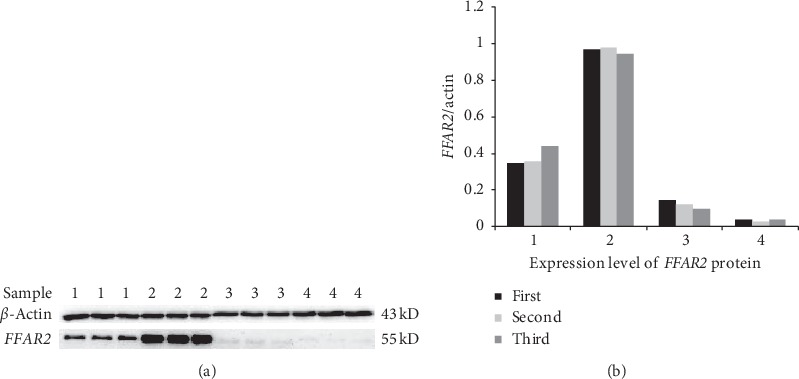
Expression level of FFAR2 protein. In the control group, the sample numbers are 1 and 2, and in the AMI group, the sample numbers are 3 and 4. AMI = acute myocardial infarction.

Expression level of FFAR2 protein. In the control group, the sample numbers are 1 and 2, and in the AMI group, the sample numbers are 3 and 4. AMI = acute myocardial infarction.