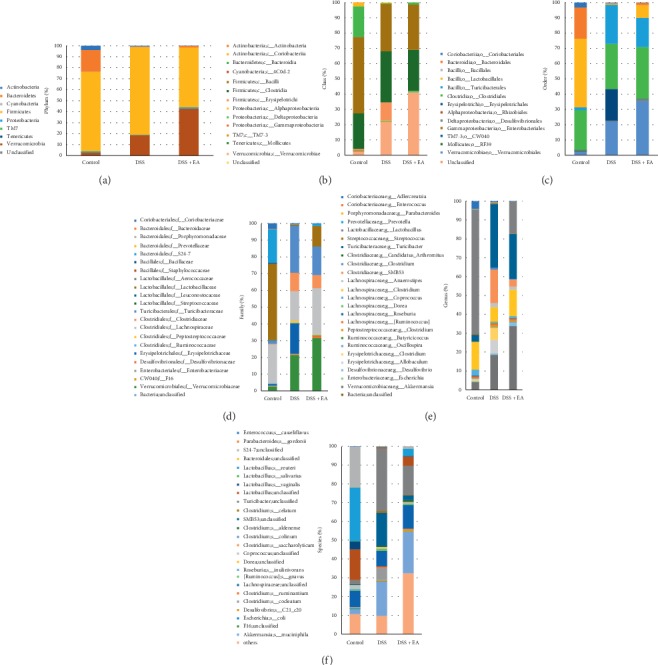
Figure 4.

Gut microbial community structure in mice after EA treatment. (a) Microbial community bar plot by phylum. (b) Microbial community bar plot by class. (c) Microbial community bar plot by order. (d) Microbial community bar plot by family. (e) Microbial community bar plot by genus. (f) Microbial community bar plot by species. From left to right, control, DSS, and DSS + EA groups, respectively. N = 3 in each group. EA: electroacupuncture ST36.
