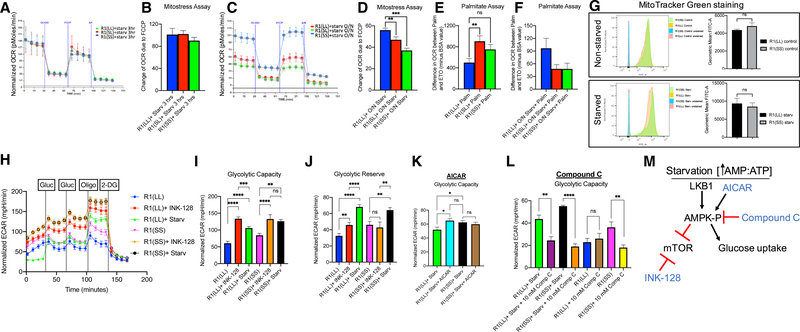
Figure 4. Lkb1 Short Does Not Respond Dynamically to Starvation, and Diapause-like State Cells Have Higher Glycolytic Activity Compared to Control Metabolic Flux in Mouse ESCs with Different Lkb1 Splice Variants.
(A–F) Short Lkb1 does not respond dynamically to starvation. Metabolic flux of mouse ESCs with different Lkb1 splice variants using Seahorse analyzer.
(A) Representative trace of OCR changes is shown under a MitoStress protocol.
(B) Quantification of A (4 independent experiments).
(C) Representative trace of OCR changes of mouse ESCs with R1(SS) or R1(SL) lines have reduced OCR changes in response to FCCP compared to R1(LL) splicevariant of Lkb1.
(D) Quantification of C (4 independent experiments). n = 28 per group, p = 0.0076 R1(LL) versus R1(SL), p < 0.0001 R1(LL) versus R1(SS).
Mouse ESC lines with short Lkb1 splice variant cannot respond dynamically to stress.
(E) mESCs with Lkb1 short splice variant show high mitochondrial beta-oxidation when substrate, fatty acid palmitate (Palm) is offered for oxidation in normalconditions. n = 7 per group, p = 0.0088 R1(LL) versus R1(SL), p = 0.062 R1(LL) versus R1(SS).
(F) The mESC lines with Lkb1 SL and SS splice variants show lower fatty acid beta-oxidation levels than R1(LL, blue). n = 7 per group, p = 0.073 R1(LL) versus R1(SL).
(G) MitoTracker Green staining of R1(LL) and R1(SS). No change in mitochondrial mass was detected between R1(LL) and R1(SS) in normal or starvationconditions.
(H) Representative trace of ECAR changes in response to glucose, oligomycin, and 2-DG is shown under a glucose stress protocol.
(I and J) Using starvation and INK-128, naive mESCs, R1(LL), and R1(SS), under starvation or INK-128, have higher glycolytic capacity (I) and glycolytic reserve (J) compared to naive mESCs under normal conditions.
(I) n = 12 for R1(LL) and R1(SS), n = 9 for R1(LL)+INK-128, n = 15 for R1(LL)+starv, n = 22 for R1(SS)+starv, n = 8 for R1(SS)+INK-128. p < 0.0001 for R1(LL) versusR1(LL)+INK-128, p < 0.0001 for R(LL) versus R1(LL)+starv, p < 0.0007 for R1(LL)+starv versus R1(LL)+INK-128, p < 0.0026 for R1(SS) versus R1(SS)+INK-128, p < 0.0001 for R1(SS) versus R1(SS)+starv, p = 0.0088 for R1(LL) versus R1(SS), p = 0.0109 for R1(LL)+starv versus R1(SS)+starv.
(J) n values are the same as Figure 4I. p = 0.0063 for R1(LL) versus R1(LL)+INK-128, p < 0.0001 for R(LL) versus R1(LL)+starv, p < 0.0001 for R1(LL)+starv versus R1(LL)+INK-128, p = 0.0022 for R1(SS) versus R1(SS)+starv, p = 0.0030 for R1(SS)+starv versus R1(SS)+INK-128, p = 0.0176 for R1(LL) versus R1(SS).
(K) No glycolytic capacity differences were observed between R1(LL) and R1(SS) under starvation when AICAR is added to R1(LL). n = 11 for R1(LL)+starv, n = 12 for the rest, p = 0.537 for R1(LL)+starv+AICAR versus R1(SS)+starv, p = 0.0171 for R1(LL)+starv versus R1(LL)+starv+AICAR, p = 0.5267 for R1(SS)+starv versus R1(SS)+AICAR, p = 0.0350 for R1(LL)+starv versus R1(SS)+starv.
(L) Compound C, an inhibitor of AMPK, reduces the glycolytic capacity observed under starvation for both Lkb1 splice variants. n = 4 for R1(SS), n = 5 for R1(LL) and R1(LL)+10 mM compound C, rest, n = 6. p = 0.0027 for R1(LL)+starv versus R1(LL)+starv+10 mM compound C, p < 0.0001 for R1(SS)+starv versus R1(SS)+starv+10 mM compound C, p = 0.5978 for R1(LL) versus R1(LL)+10 mM compound C, p = 0.0056 for R1(SS) versus R1(SS)+10 mM compound C.
(M) Model of AMPK pathway. AMPK, once phosphorylated by Lkb1, can stimulate glucose uptake and inhibit mTOR while INK-128 inhibits mTOR.

