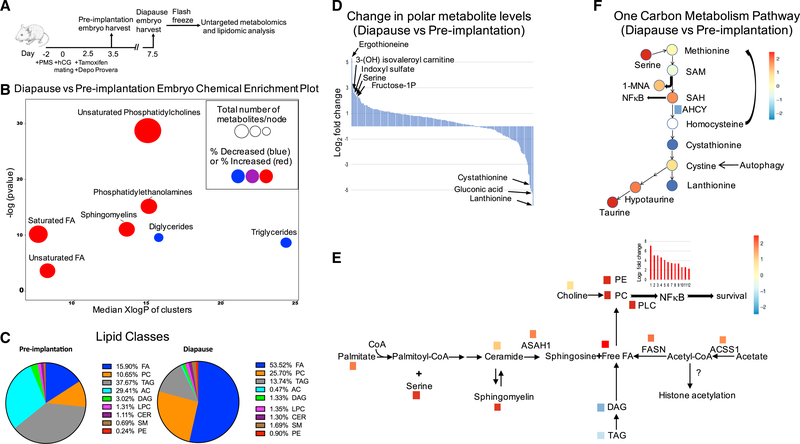
Figure 5. Overall Changes of Lipids and Polar Metabolites between Diapause and Pre-implantation Blastocyst.
(A) Schematic diagram depicting outline of the metabolomics experiment for pre-implantation or diapause embryos.
(B) Chemical enrichment analysis of diapause blastocyst compared to pre-implantation blastocyst show dramatic differences in lipid composition. Node size reflects the number of metabolites and color indicates direction of change, blue is decreased and red increased. The y axis indicates enrichment p values calculated by Kolmogorov-Smirnov-test and x axis show the polarity of chemical clusters.
(C) Relative lipid classes between diapause and pre-implantation blastocyst.
(D) Log2 fold change of a total of 243 polar metabolites that were identified between diapause and pre-implantation blastocyst.
(E) Schematic diagram of sphingolipid metabolism showing metabolites and genes that are upregulated in diapause compared to pre-implantation. D, diapause;PI, pre-implantation; TAG, Triacylglycerol; DAG, Diacylglycerol; ASAH1, N-acylsphingosine amidohydrolase 1; ACSS1, acyl-CoA synthetase short-chain family member 1; FASN, fatty acid synthase.
(F) One-carbon metabolism pathway indicating metabolites that are increased or decreased and their connections with other pathways.

