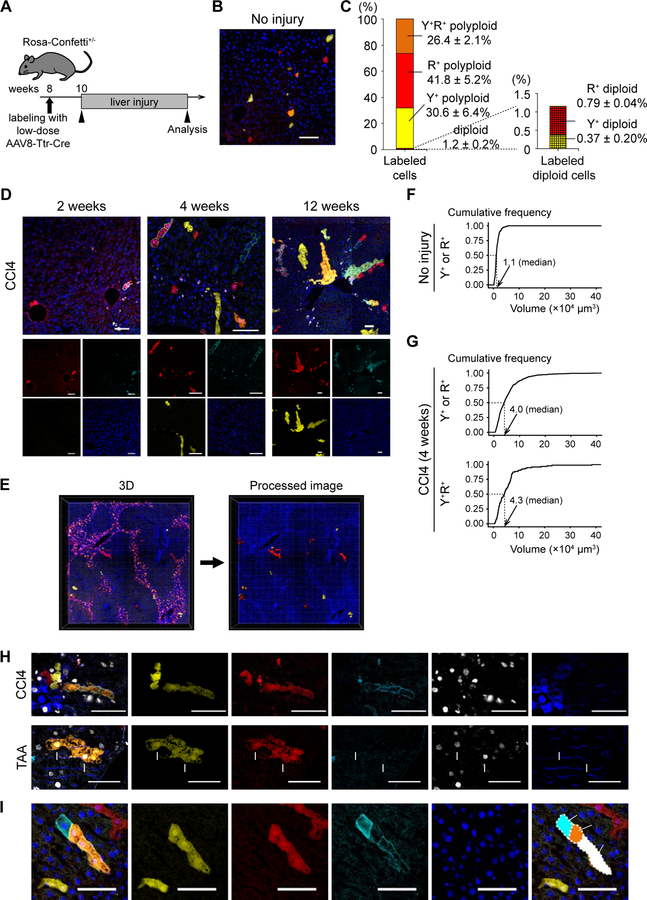
Figure 4. Tracing of single cell-derived clonal expansions in Rosa-Confetti+/− mice.
(A) Scheme to trace sparsely-labeled hepatocytes. (B) Representative image of the sparsely-labeled liver. (C) Distribution of ploidy and reporter gene expression of sparsely-labeled hepatocytes. mCFP was not analyzed due to its dim signal. Values are shown as means ± SD (n = 3). (D) Microscopic images of representative sparsely-labeled livers after CCl4 injury. The livers were injured with CCl4 for the indicated time. (E) 3D reconstructed images of the sparsely-labeled liver injured with CCl4. YFP, RFP, and Hoechst (nuclei) signals were imaged. mCFP, which was quenched by the tissue clearing process, was not detected in 3D imaging. YFP+ and/or RFP+ cells were extracted for analysis using Imaris software, and the processed image is shown in the right panel. (F, G) Cumulative frequency graphs of the volumes of clonal areas. The data of untreated control livers (F) and CCl4-injured livers (G) are shown. More than 350 clones in 3 or more mice were analyzed. The median values are indicated. (H) Immunofluorescence for Ki67 and GS. Representative results of the livers injured with CCl4 for 4 weeks or TAA for 3 months are shown. Ki67+ multicolored hepatocytes are indicated by arrowheads or arrows. (I) Representative images of a clonal expansion suggesting ploidy reduction. Images were stitched to generate large composite images. Y+, YFP+; R+, RFP+; C+, mCFP+; C, central veins; P, portal veins. Scale bars: 100 μm. See also Figure S5.

