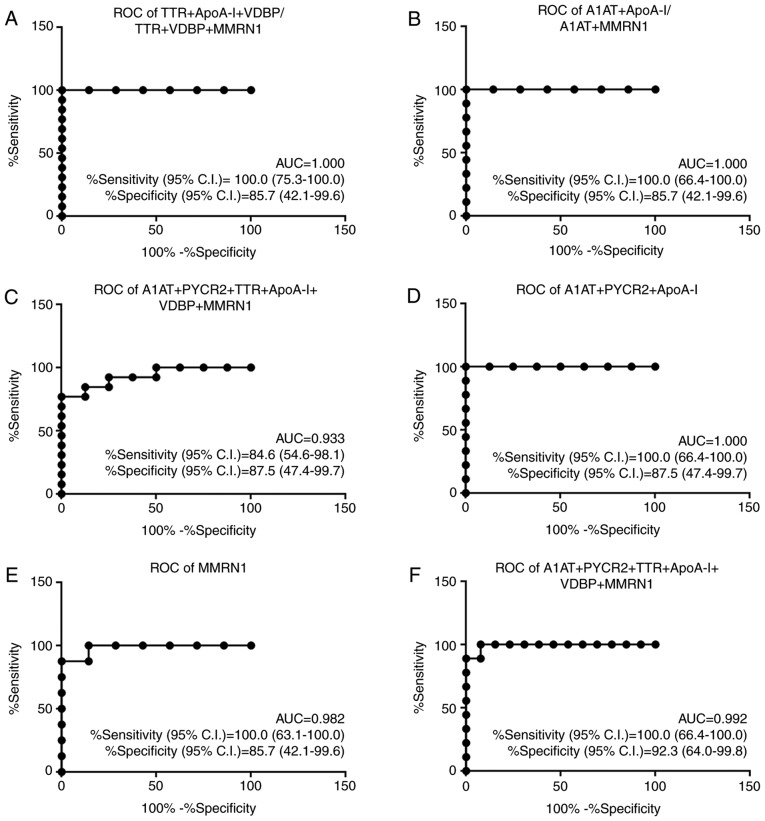
Figure 5.
Performance of the best marker models for each comparison. AUC, sensitivity with 95% CI and specificity with 95% CI are stated. (A) Comparison of normal controls with HPV-negative vs. early-stage (N- vs. E). (B) Comparison of normal controls with HPV-negative vs. late stage (N- vs. L). (C) Comparison of normal controls with HPV-positive vs. early-stage (N+ vs. E). (D) Comparison of normal controls with HPV-positive vs. late stage (N+ vs. L). (E) Comparison of normal controls with HPV-negative vs. normal controls with HPV-positive (N- vs. N+). (F) Comparison of early-stage vs. late stage cervical cancer (E vs. L). ROC, receiver operating characteristic; AUC, area under the ROC curve; CI, confidence interval; A1AT, α-1-antitrypsin; PYCR2, pyrroline-5-carboxylate reductase 2; TTR, transthyretin; ApoA-I, apolipoprotein A-I; VDBP, vitamin D binding protein; MMRN1, multimerin-1.

