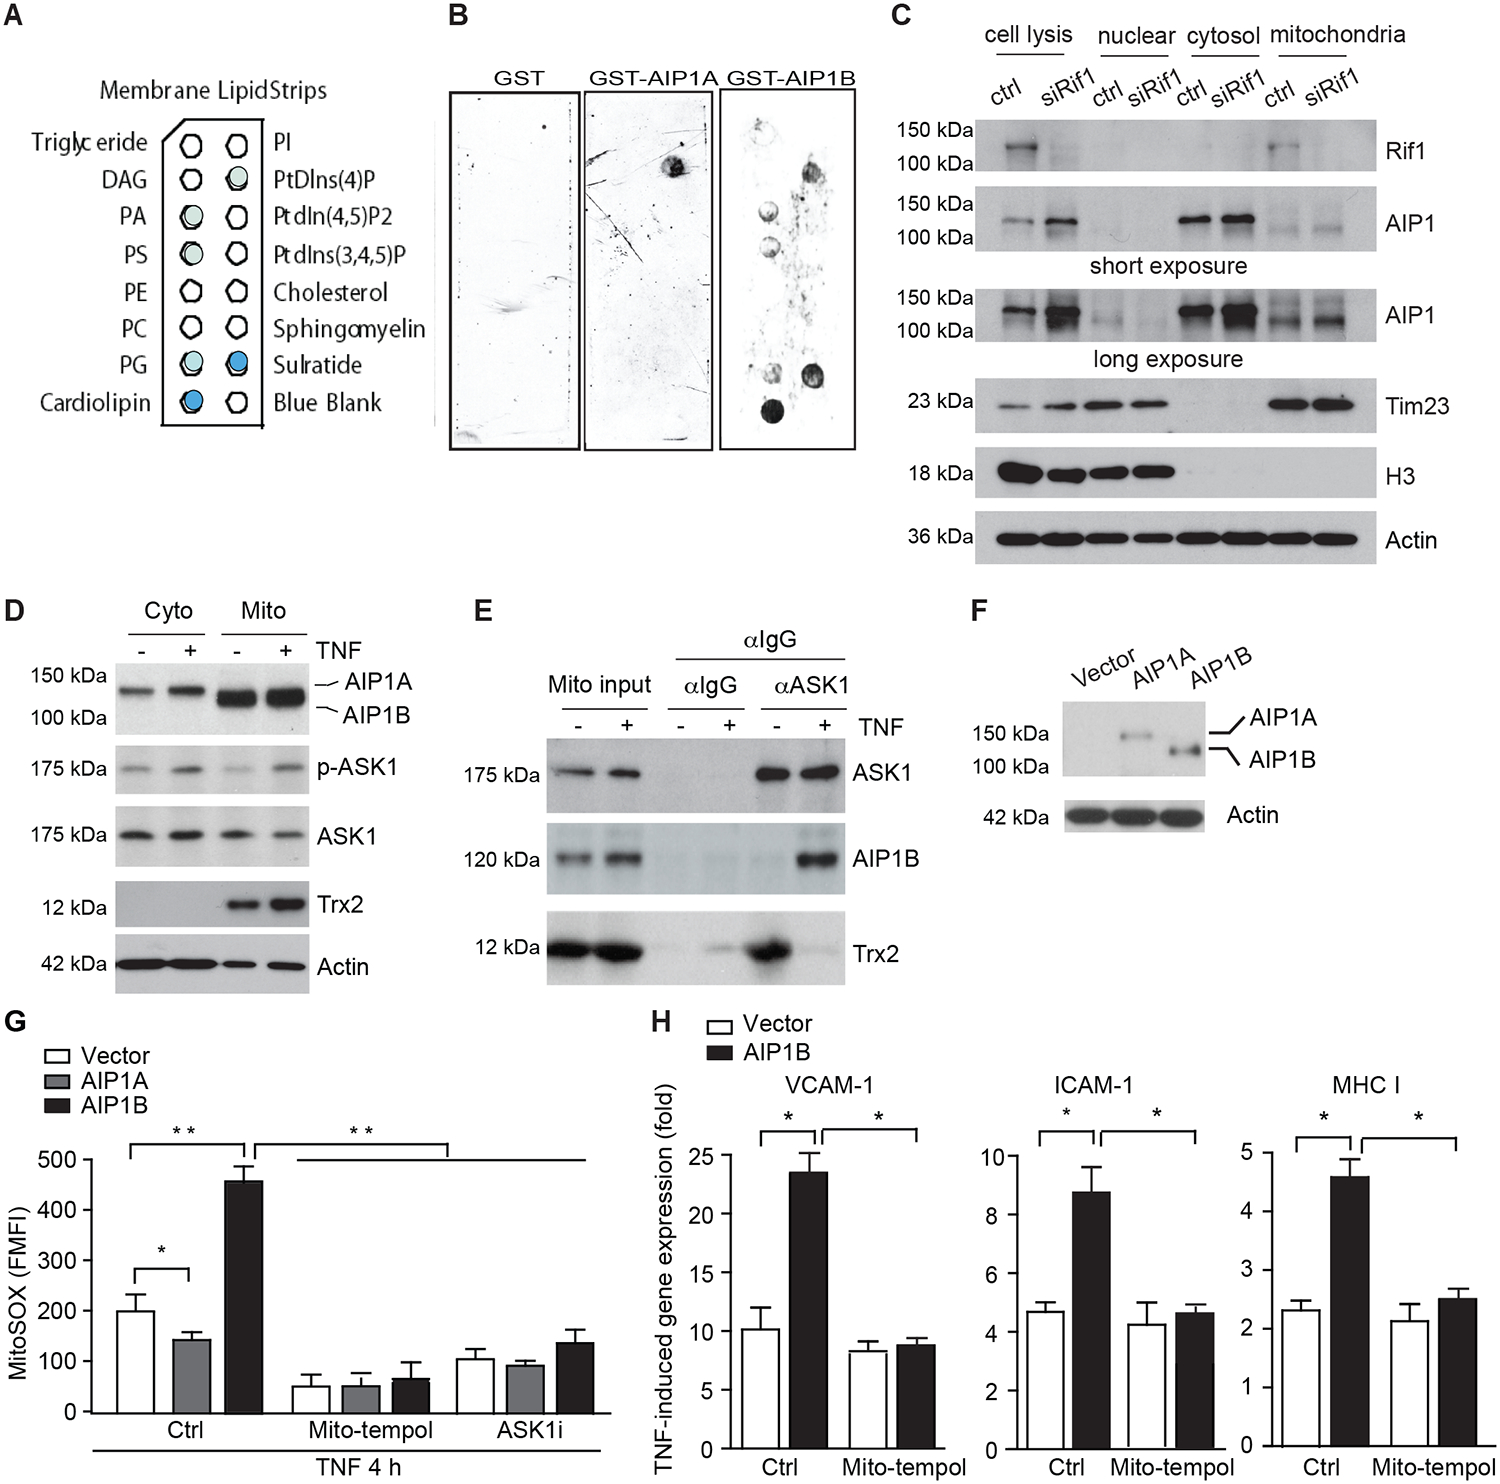
Fig.4. AIP1B localized to the mitochondria where it augmented TNF-induced ROS production and EC activation.

A-B. AIP1B bound to the mitochondrial lipid, cardiolipin, in a membrane lipid strip assay that used recombinant GST, GST-AIP1A, and GST-AIP1B. The identity of each lipid spot (A) and images of the strip (B) are presented. The positive spots are marked by solid colors where cardiolipin exhibited the strongest binding. n=2. C. Endogenous AIPB localized to the mitochondria. HUVECs were transfected with control or RIF1 siRNA. Cellular fractionation was performed to isolate nuclear, cytosolic, and mitochondrial fractions. Levels of RIF1, AIP1, the mitochondrial marker, Tim23, and the nuclear marker, histone H3, were determined by western blotting. n=4. D-E. RIF1 siRNA-transfected HUVECs were untreated or treated with TNF (10 ng/ml for 4 h). (D) Cytoplasm and mitochondrial fractions were isolated and phosphor-ASK1 (p-T845) and protein expression were determined by immunoblotting. (E) Mitochondrial fractions were subjected to co-immunoprecipitation assay with anti-ASK1 followed by immunoblotting with anti-ASK1 and anti-Trx2. n=2. F-H. AIP1B enhanced ROS production and inflammation. HUVECs were transfected with siRNA against the AIP1 3’UTR to knockdown endogenous AIP1 and then infected with lentivirus expressing EGFP (Vector), AIP1A or AIPB. (F) Western blotting with anti-pan-AIP1. (G) Cells were pre-treated with mitoROS scavenger mito-tempol (10 μM) or ASK1 inhibitor (10 μM) for 1 h, followed by TNF treatment for 4 h. Intracellular ROS were detected by flow cytometry with a specific probe MitoSOX. (H) Cells were treated with TNF (10 ng/ml) in the absence (Ctrl) or presence of mito-tempol (10 μM) for 12 h, and TNF-induced VCAM-1, ICAM-1 and MHC class I expression was measured with RT-PCR that was normalized to GAPDH. TNF-induced fold changes compared to the untreated controls are presented. n=3. All data are presented as the mean ± SEM. * P<0.05, ** P<0.01, two-way ANOVA (G) or unpaired, two tailed t-test (H).
