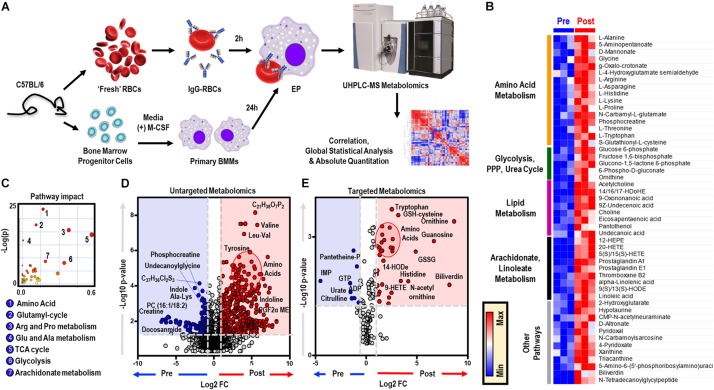
FIGURE 1.
In vitro assessment of BMDM EP. Mouse RBCs were incubated with rabbit, anti-mouse RBC IgG. BMDMs were then incubated with PBS (control) or with IgG-coated RBCs for in vitro opsonization to reflect EP. (A) Metabolic correlates identified before (Pre) and after (Post) EP were plotted as a hierarchically-clustered heat map (B). The metabolome view map of relevant metabolic pathways showed significant changes in cellular metabolic pathways following EP (C). Univariate analysis of the BMDM metabolome using untargeted (D) and targeted (E) metabolomics methods to identify metabolites that change due to EP. The region highlighted in red (fold change (FC) ≥ 2.0; p-value < 0.05) indicates metabolites that are present in significantly higher amounts in BMDMs following EP (Post); whereas, the region highlighted in blue (fold change ≤ 0.5; p-value < 0.05) indicates metabolites that accumulate in BMDMs before EP (Pre). Amino acids identified clustered in similar regions of Pre were encircled (red).

