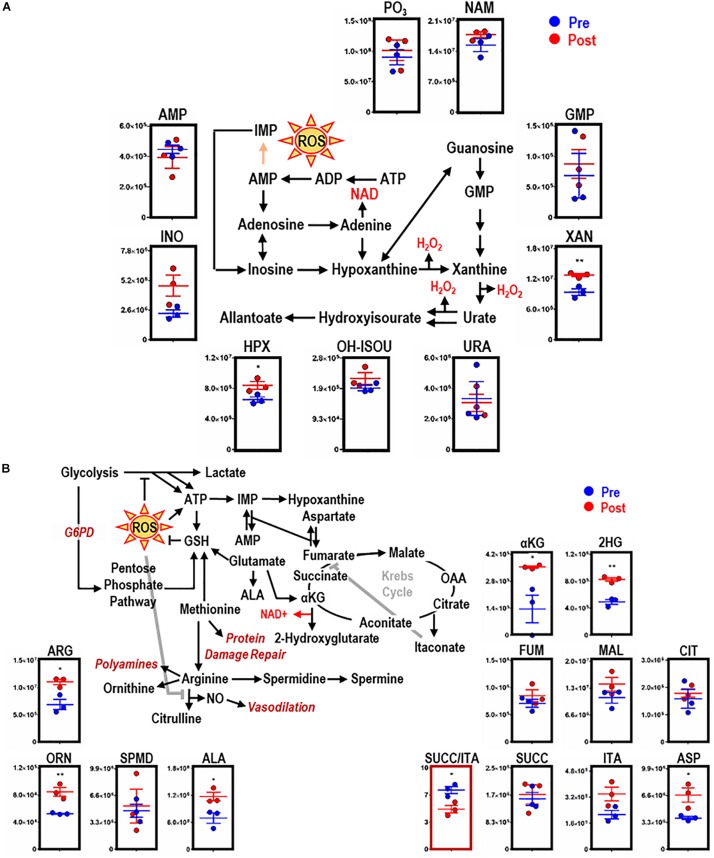
FIGURE 4.
EP remodels purine and arginine metabolism, glutathione homeostasis, and the Krebs cycle in BMDMs. Overview and downstream metabolites of purine metabolism with entry into this pathway beginning with adenosine triphosphate (ATP) (A). Overview of arginine (ARG) metabolism, GSH homeostasis, and the Krebs cycle (B). For all plots, the y-axis represents relative intensity (a.u.). *p ≤ 0.05; **p ≤ 0.01; ***p ≤ 0.001 (unpaired t-test, 2-tailed distribution). PO3, phosphate; URA, urate; AMP, adenosine monophosphate; NAM, nicotinamide; HPX, hypoxanthine; INO, inosine; XAN, xanthine; ALA, aminolevulinate; ASP, aspartate; 2HG, 2-hydroxyglutarate; SUCC, succinate; ORN, ornithine; OH-ISOU, hydroxyisourate; SPMD, spermidine; SPM, spermine; ITA, itaconate; FUM, fumarate; CIT, citrate; MAL, malate; αKG, α-ketoglutarate.

