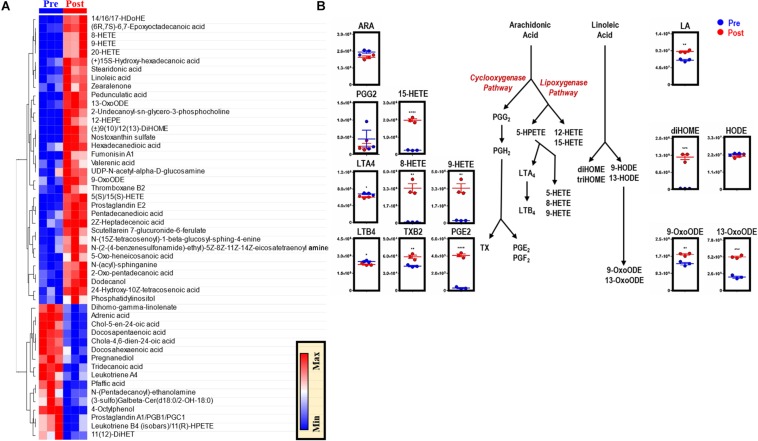
FIGURE 5.
EP reprograms arachidonate and linoleate metabolism in BMDMs. The top 50 metabolites in BMDMs that are part of eicosanoid and oxylipin synthesis and change significantly following EP (A). Values are plotted as a hierarchically-clustered heat map based on p-value. Overview of eicosanoid and oxylipin metabolism, stemming from arachidonic acid (ARA) and linoleic acid (LA) (B). For all plots, the y-axis represents relative intensity (a.u.). *p ≤ 0.05; **p ≤ 0.01; ***p ≤ 0.001 (unpaired t-test, 2-tailed distribution). PGG2, prostaglandin G2; PGH2, prostaglandin H2; PGE2, prostaglandin E2; PGF2, prostaglandin F2; HETE, hydroxyeicosatetraenoic acid; HPETE, hydroperoxyeicosatetraenoic acid; LTA4, leukotriene A4; LTB4, leukotriene B4; TX, thromboxane; TXB2, thromboxane B2; diHOME, dihydroxyoctadecanoic acids; triHOME, trihydroxyoctadecanoic acids; HODE, hydroxyoctadecadienoic acid; OxoODE, oxooctadecadienoic acid.

