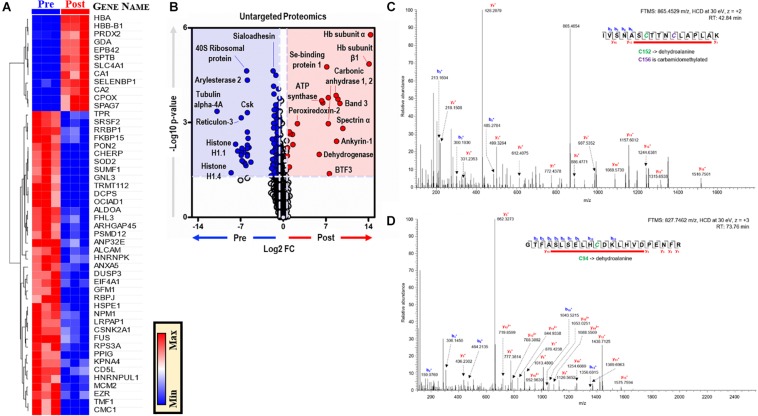
FIGURE 6.
EP alters the BMDM proteome. (A). The top 50 proteins in BMDMs that are significantly changed by EP (A). Values are plotted as a hierarchically-clustered heat map based on p-value with proteins listed by gene name. Univariate analysis of the BMDM proteome using untargeted proteomics to identify proteins that change due to EP (B). The region highlighted in red (FC > 1.5; p < 0.05) indicates proteins present in significantly higher amounts in BMDMs after EP (Post); whereas, the region highlighted in blue (FC < 0.67; p < 0.05) indicates proteins found to be accumulated in BMDMs before EP (Pre). Representative tandem mass spectrometry spectra with deduced protein sequences for glyceraldehyde 3-phosphate dehydrogenase (GAPDH) (C) and hemoglobin-β (D). Dehydroalanine modification of Cys152 and carbamidomethylation of Cys156 in the active site of GAPDH (C). Dehydroalanine modification of Cys94 adjacent to the heme binding site (H93, proximal) in the hemoglobin-β chain (D).

