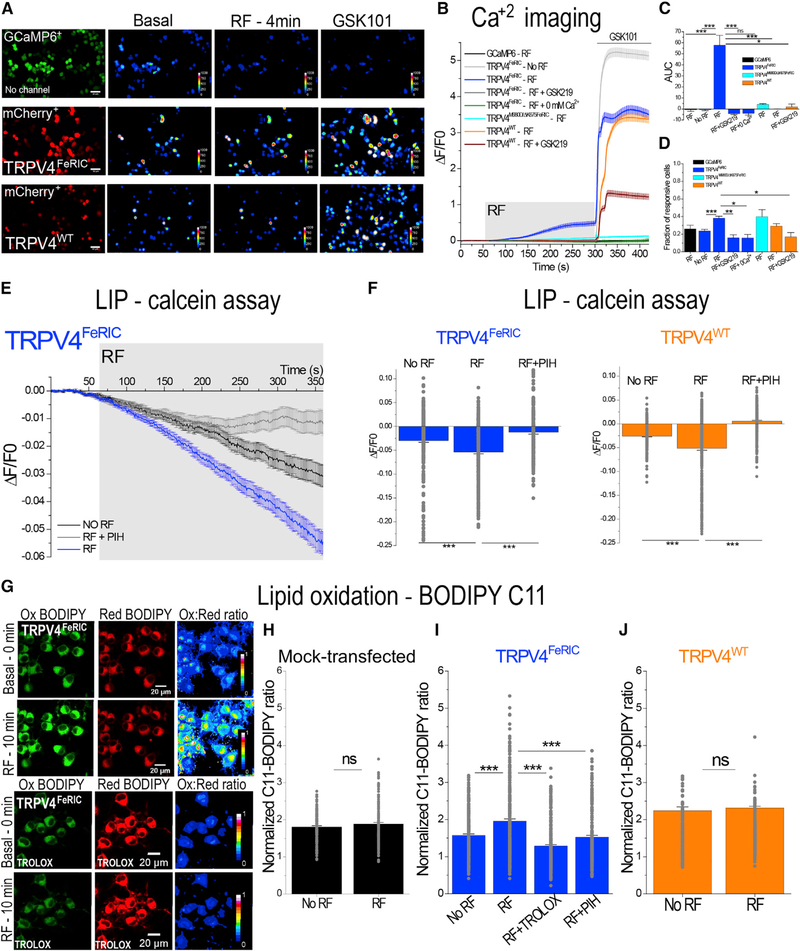
Figure 1. RF Increases the Cytosolic Ca2+ Concentration, the Labile Iron Pool (LIP), and the Levels of Lipid Oxidation in TRPV4FeRIC-Expressing N2a Cells.
(A) Leftmost column: representative images of N2a cells expressing GCaMP6 or GCaMP6 plus TRPV4FeRIC or TRPV4WT (mCherry+). Columns on the right: pseudo-color images of GCaMP6 fluorescence before (Basal) and after RF stimulation (12 μT), following 1 μM GSK101. Scale bars, 50 μm.
(B) Average changes (± SEM) in GCaMP6 ΔF/F0 in N2a cells expressing GCaMP6 or GCaMP6 plus TRPV4FeRIC, TRPV4M680D/ΔK675FeRIC, or TRPV4WT following exposure to RF (4 min, gray rectangle) and next GSK101 (bar). In separate series, cells were imaged without RF stimulation (no RF), in the absence of extracellular Ca2+ (0 mM Ca2+), or in the presence of GSK219.
(C) Averages of the GCaMP6 AUC (± SEM) for the period of RF stimulation.
(D) Cell responsiveness (± SEM) for data in (C).
(E) Average changes (± SEM) in calcein ΔF/F0 in N2a cells expressing TRPV4FeRIC imaged in the absence of RF (NO RF) or in the presence of RF (RF). In separate series, cells were first incubated with PIH and then imaged upon RF stimulation (RF + PIH).
(F) Average changes (± SEM) of calcein ΔF/F0 in cells expressing TRPV4FeRIC or TRPV4WT in the absence of RF, in the presence of RF, or in the presence on RF plus PIH.
(G) Representative confocal images of N2a cells expressing TRPV4FeRIC and labeled with BODIPY 581/591 C11 (BODIPY C11). The emissions of Ox and Red BODIPY C11 forms were collected at 490–520 nm and 570–620 nm, respectively.Pseudo-color images indicate the ratio of the fluorescence of the Ox to Red forms of BODIPY C11. Cells were imaged at the beginning of the experiment (Basal - 0 min) and after 10 min in the presence of RF or in the presence of RF plus TROLOX. Scale bars, 20 μm.
(H–J) Normalized BODIPY C11 Ox/Red ratio (± SEM) of (H) mock-transfected cells or cells expressing (I) TRPV4FeRIC or (J) TRPV4WT imaged after 10 min in the absence or in the presence of RF. In separate experiments, cells were pretreated with TROLOX or PIH following stimulation with RF. Data were normalized to the basal BODIPY C11 ratio obtained at the beginning of every single experiment. GCaMP6 data correspond to 3–13 independent experiments with 59–488 cells analyzed. For calcein data, 189–408 cells from 4–6 independent experiments were analyzed. For BODIPY C11 data, 228–314 cells from 4–8 independent experiments were analyzed. For this and the following figures, data correspond to the averages from all TRPV-expressing cells, and significance was determined using Student”s t test (n = 2) or one-way ANOVA (n > 3) followed by Tukey”s multiple comparisons test. For nonparametric data, significance was determined using Kruskal-Wallis ANOVA followed by Dunn”s multiple comparisons test. Where applicable, *p < 0.05, **p < 0.001, or ***p < 0.0001 was considered a statistically significant difference.

