
Figure 4.
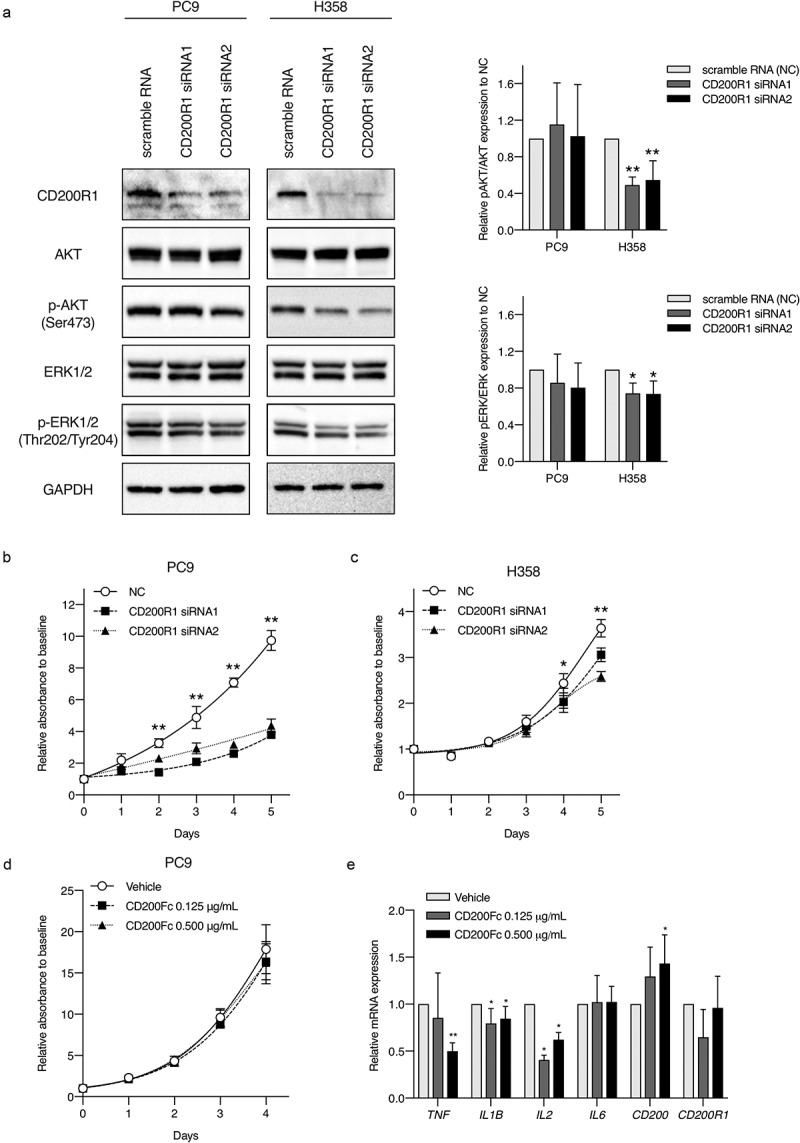
Evaluation of CD200R1 functions with CD200R1 knockdown and CD200Fc administration.
(a) Western blots in the left part showing the representing protein levels after CD200R1 knockdown with siRNA in PC9 and H358 cells, respectively. Bar graphs on the right part show western blotting quantification of pAKT/AKT and pERK/ERK in the siRNA1 and siRNA2 groups relative to those in negative controls (NCs). The data represent the mean ± SD, N = 4. *P <.05 and **P <.001 vs. NC (one-way ANOVA). (b–c) Effect of CD200R1 knockdown with siRNA on cell proliferation in PC9 and H358 cells as analyzed by CCK-8 assays. The negative control (NC) was scramble RNA-transfected cells. The data represent the mean ± SD, N = 5. *P <.05 and **P <.001 vs. NC (one-way ANOVA). (d) Effect of CD200Fc treatment on cell proliferation in PC9 cells as analyzed by CCK-8 assays. (e) Effect of CD200Fc treatment on endogenous mRNA expression levels of immune markers in PC9 cells as analyzed by RT-qPCR. Gene expression was normalized to the expression of GAPDH and is shown relative to vehicle control expression. The data represent the mean ± SD, N = 3. *P <.05 and **P <.001 vs. vehicle (Student’s t-test).