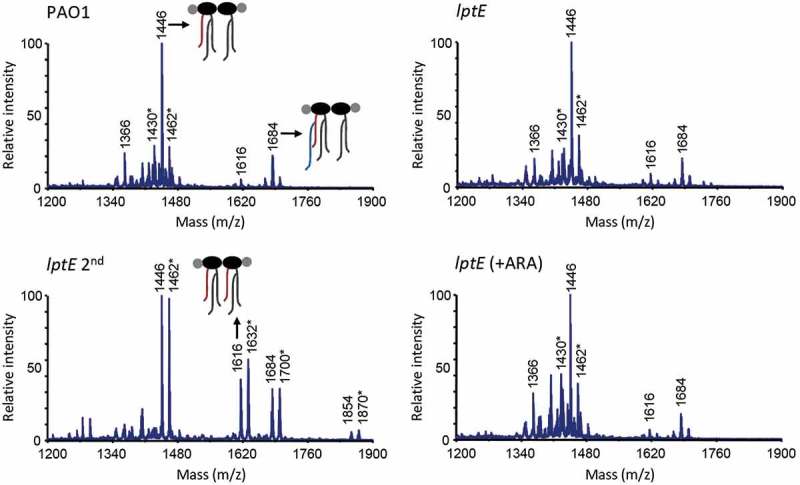
Figure 5.

MALDI-TOF analysis of lipid A extracted from wild type (PAO1) and lptE mutant cells cultured in MH with or without 0.5% arabinose (ARA). lptE 2nd corresponds to the lptE conditional mutant cultured for two subsequent passages in the absence of ARA (see the legend of Figure 1 for details). Spectra were obtained in the ion negative mode, thus m/z values correspond to (molecular mass – 1)/1. Spectra are representative of three biological replicates. Relevant lipid A forms are shown with cartoons: m/z = 1646, penta-acylated lipid A; m/z = 1616, hexa-acylated lipid A; m/z = 1684, penta-acylated lipid A with the addition of a palmitoyl group (in blue). Asterisks indicate lipid A forms that vary due to the removal (m/z −16) or addition (m/z + 16) of a hydroxyl group to the secondary C12 acyl chains. The chemical structures of the identified lipid A forms are shown in Fig. S9.
