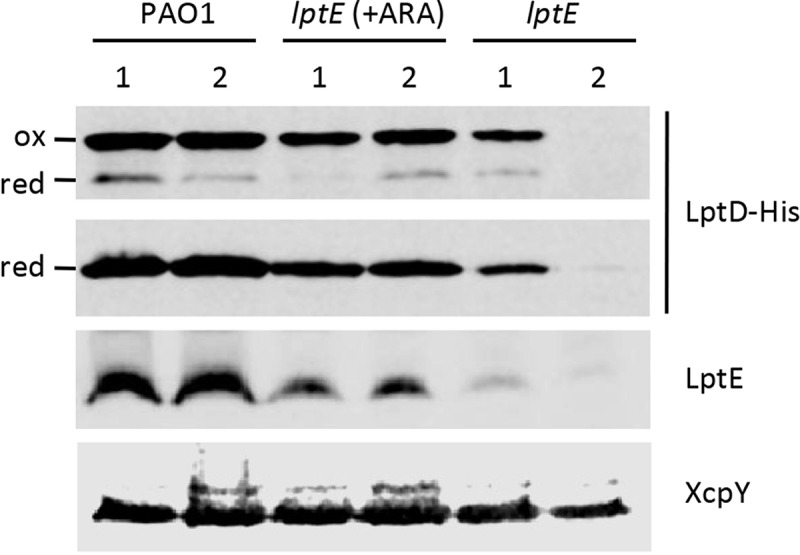
Figure 6.

LptD levels in LptE-depleted cells. Total membrane samples were obtained from PAO1 lptD-6his and lptE lptD-6his cells grown as described in the legend of Figure 1. Cells were collected at OD600 = 0.8, both for the first (lanes 1) and the second refresh (lanes 2). Total membrane proteins corresponding to an OD600 = 1.6 were loaded in each lane. Filters were immunoblotted using antibodies raised against the 6His tag to detect LptD-6His, against LptE, or against XcpY, as indicated on the right of each blot. To analyze the oxidation state of LptD (red, reduced; ox, oxidized), membrane samples were treated with SDS loading buffer containing (lower panel) or not 5% β-mercaptoethanol (upper panel). Images are representative of three independent experiments giving similar results.
