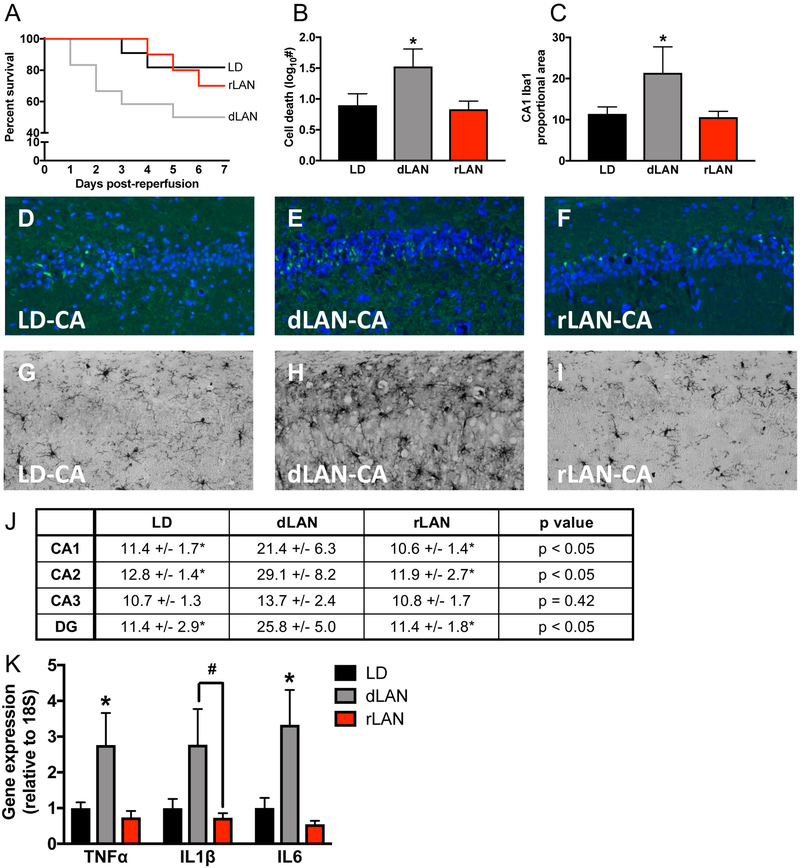
Figure 4. Manipulation of lighting wavelength minimizes light at night induced damage following CA.
The experimental outline in Figure 4 followed the same timing as Figure 1a (n = 12/group, 6 – 10 surviving, see supplemental table 1). (a) Kaplan Meier curve illustrating survival of mice exposed to dark nights (LD), dim light at night (dLAN), or red light at night (rLAN) following CA. (b) the dLAN group had significantly greater neuronal damage (FJC staining) and (c) increased proportional area of Iba1 staining in the hippocampus at one week after CA than either the CA-LD or CA-rLAN groups; the CA-LD or CA-rLAN groups did not differ significantly in either of these measures. Representative photomicrographs of FJC staining in the CA1 region of the hippocampus (20X) one week after CA in the (d) LD, (e) dLAN, and (f) rLAN groups. Representative photomicrographs of Iba1 staining in the CA1 region of the hippocampus (20X) one week after CA in the (g) LD, (h) dLAN, and (i) rLAN groups. (j) Table providing proportional area of Iba1 staining in subregions of the hippocampus as an indication of microglial activation. (k) Gene expression of TNFα, IL1β, and IL6 is significantly elevated in the hippocampus 24 h following CA in the CA-dLAN group relative to the rLAN group and CA-LD groups (n = 7 – 8/group). Gene expression was assessed via qPCR and is presented as fold increase relative to a housekeeping gene (18S). The data are provided as mean±SEM; an asterisk represents a significant difference between dLAN and both other groups (p<0.05), whereas a pound sign (#) indicates the dLAN group only significantly differs from the rLAN group (p<0.05).

