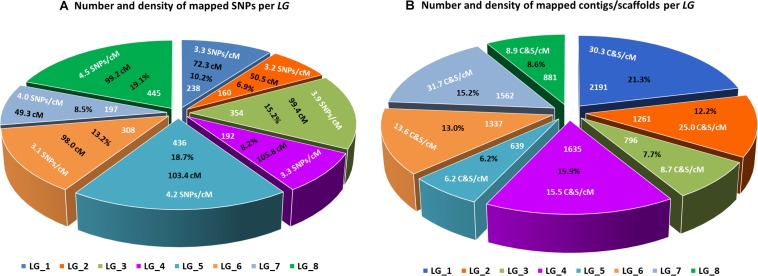
FIGURE 4.
Lepidium linkage groups. (A) Size of each linkage group in centimorgans (cM), number and percentage of SNPs mapped to each linkage group, and average number of mapped SNPs per centimorgan. (B) Number and percentage of contigs/scaffolds mapped to each linkage group, and average number of mapped contigs/scaffolds per centimorgan.

