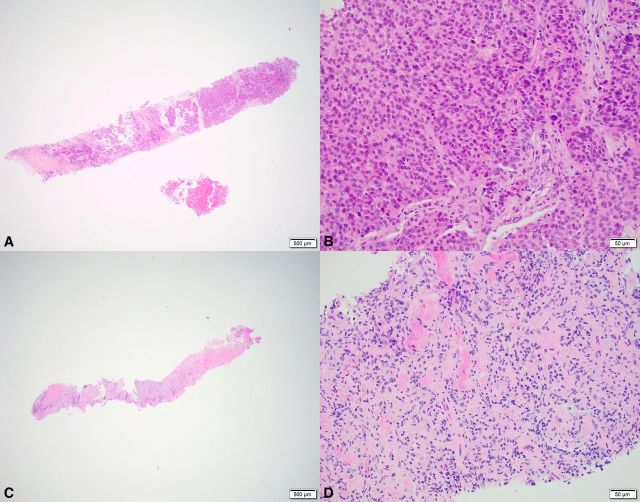
Figure 1.
Example of a patient with partial response and decrease in TC from baseline to on-treatment. Shown are overviews (A+C: ×2 magnification) and detail (B+D: ×20 magnification) of H&E-stained biopsy specimens. (A+B) Baseline biopsy specimen with ≥10% TC (category: high TC). (C+D) On-treatment biopsy specimen does not contain any tumor, but fibrosis and inflammatory cells are visible (category: low TC). TC, tumor content.

