
Figure 1.
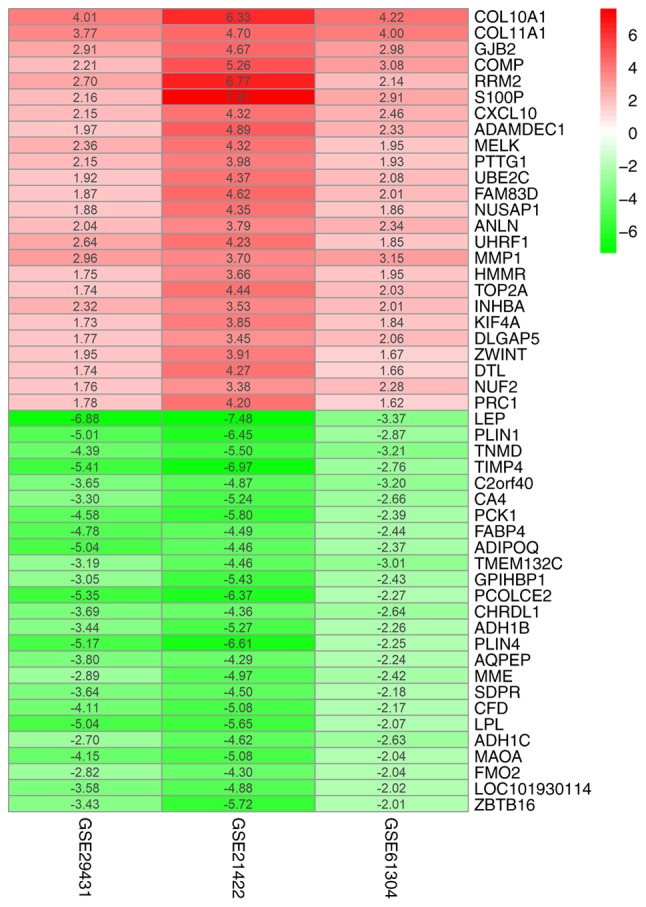
Log2(FC) heatmap of the 50 most significantly differentially regulated genes in the three microarrays. Red and green represent up- and downregulated genes, respectively. The values in the columns represent the log2FC value of each gene. FC, fold change.