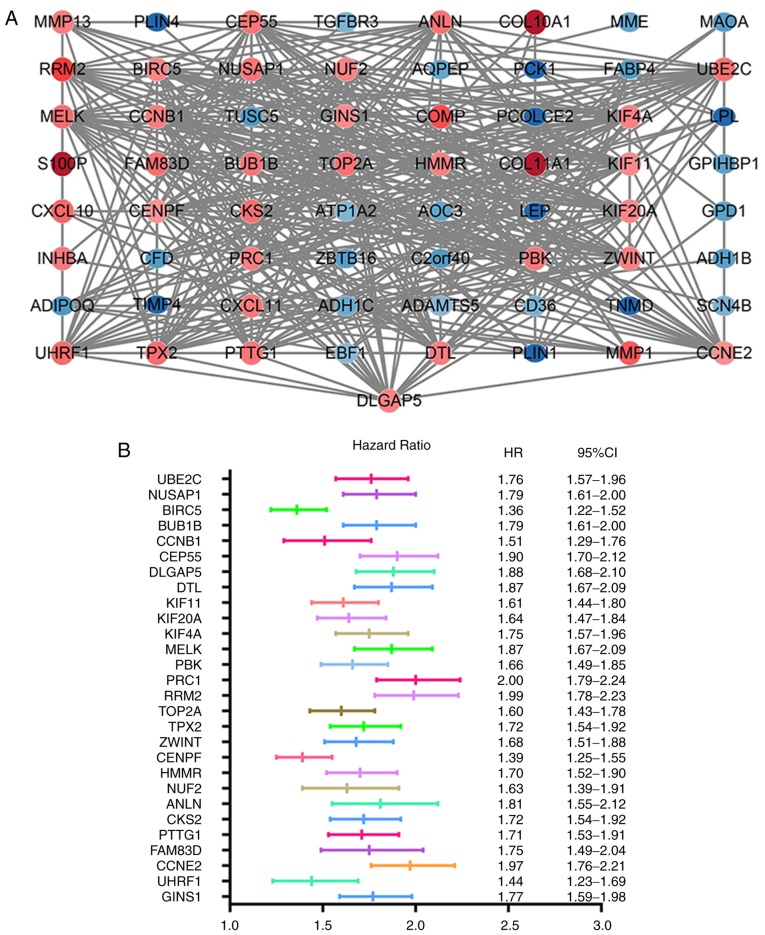
Figure 3.
PPI network of the DEGs and the forest plot of 28 hub genes associated with breast cancer prognosis in the PPI network. (A) PPI network of the DEGs. Nodes represent proteins, and edges represent connections between proteins. Red and blue circles represent upregulated and downregulated genes, respectively. (B) HRs of the hub genes. Each line in the graph represents a 95% CI, and the middle bar represents the HR. PPI, protein-protein interaction; DEGs, differentially expressed genes; HR, hazard ratio; CI, confidence interval.

