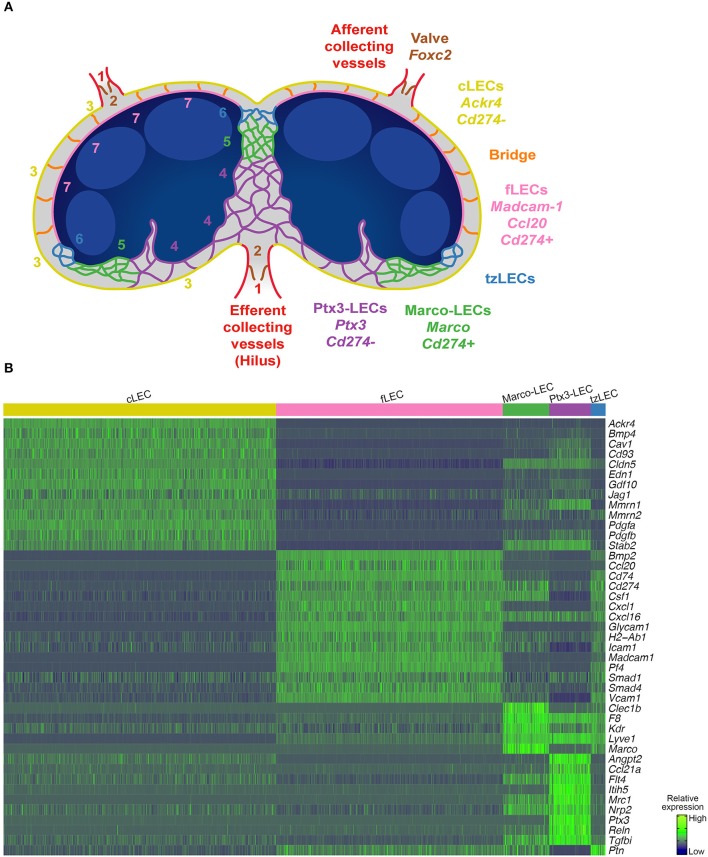
Figure 5.
Mouse LN subsets and differently expressed genes (DEGs). (A) Cartoon showing the interconnections of LN LEC subsets related to tSpace alignments (Figure 1) and in situ mapping (Figures 2–4). (B) Heatmap of selected DEGs in the C57BL/6 mouse (10x) LN LEC subsets. Values are imputed log counts (row scaled).

