Figure 6.
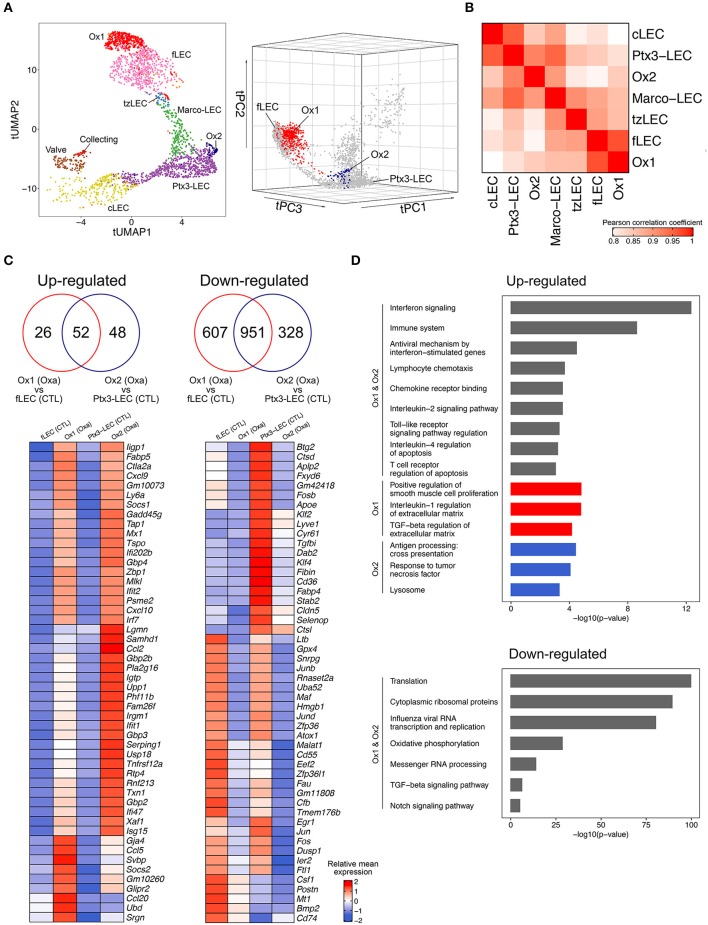
Niche-specific inflammatory responses in LN LECs. (A) tUMAP (UMAP on trajectory distances) of LEC from Oxa-treated and control mice, colored by subsets, including the two additional subsets (Ox1 and Ox2) in the Oxa-treated group (left). tPC (principal components on trajectory distances) of LEC from Oxa-treated and control mice, highlighting Ox1 (red) and Ox2 (blue) respectively (right). (B) Pairwise Pearson correlation of LEC subsets in Oxa-treated group, calculated using the subset mean expression of the top 1,000 variable genes. (C) Venn diagrams of DEGs from Ox1 in Oxa-treated LNs compared with fLEC in control LNs, and from Ox2 in Oxa-treated LNs compared with Ptx3-LEC in control LNs (upper; p < 0.01, fold change > 1.2). Heatmaps of 50 select upregulated or downregulated DEGs, with ribosomal genes excluded from the downregulated panel (lower; row scaled). (D) Select GO terms and BioPlanet pathways from Enrichr analysis of DEGs.

