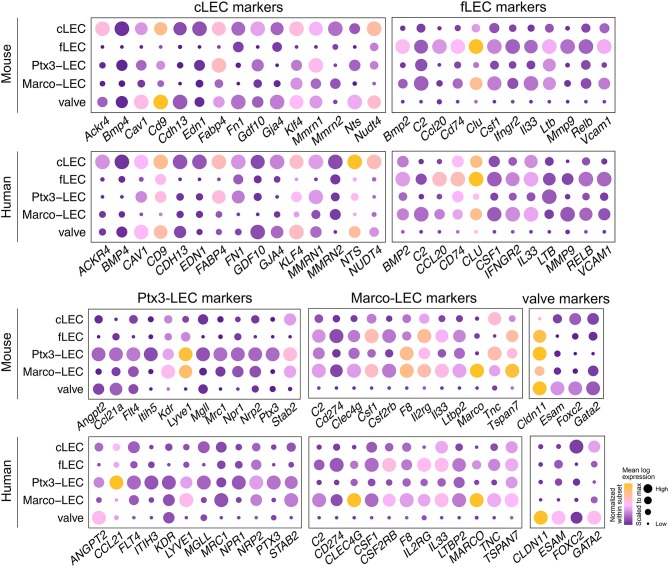
Figure 8.
Conserved gene programs for mouse and human LEC specialization. Expression of select gene homologs (or paralogs Itih5 and ITIH3) in cLECs, fLECs, Ptx3-LECs, Marco-LECs and valve LECs. Color indicates subset mean log transcript count, normalized within each subset. Dot size indicates subset mean log transcript count, scaled to the maximum value for each gene.

