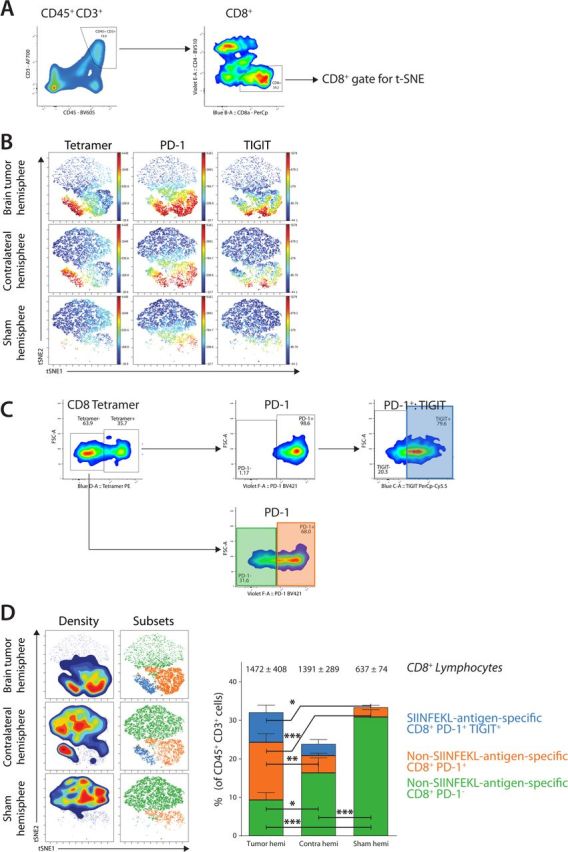
Figure 4.

Analysis of the CD8+ T lymphocyte phenotype. (A) Gating strategy for CD45+CD3+ lymphocytes and subsequently CD8+ T lymphocytes. (B) Generated t-SNE plots of CD8+ lymphocytes based on the expression of H-2Kb-SIINFEKL tetramer, programmed cell death 1 (PD-1), TIGIT showed a clear distinction between different subsets and cell abundancies. (C) Gating strategy for different populations of CD8+ T lymphocytes, based on the subsets visualized in t-SNE plots. Gating was used to determine subset abundance and statistics. (D) Density overlaid on t-SNE plot show the relative cell density in each hemisphere. Manual gating overlaid on t-SNE plots show the location of defined subsets. Bar graphs show the frequency of each CD8+ T lymphocyte subset as a percentage of total CD45+CD3+ lymphocytes. Data are represented as mean±SEM. Statistical significance was assessed by analysis of variance followed by Tukey multiple comparisons test (*p<0.05, **p<0.005, ***p<0.001).
