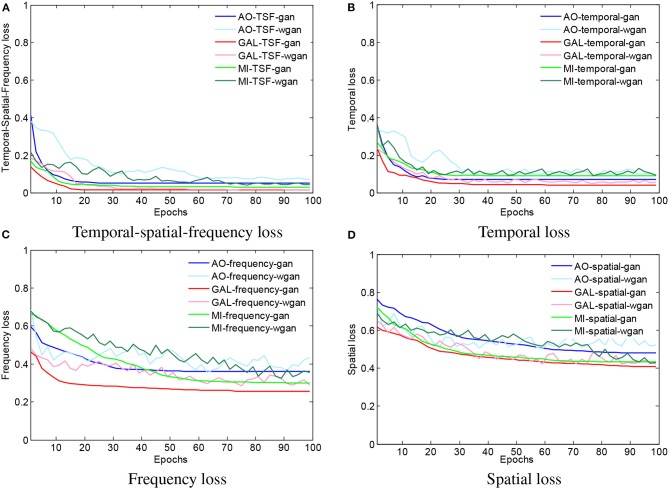
Figure 4.
The averaged MSE and Wasserstein distance estimations for training the GAN/WGAN. In the four figures, all of the iterative curves decreased rapidly within the first 10 epochs (each epoch contains 10 errors recording), and the initial decreases indicated that these two metrics are positively correlated for the EEG signal reconstruction. However, for each dataset or using GAN/WGAN frameworks, the loss results of TSF-MSE are lower than the loss results of conventional temporal, frequency, and spatial MSE. In addition, of these four losses, the WGAN frameworks oscillate in the convergence process, while the GAN frameworks are smoothed in the convergence process. (A) Temporal-spatial-frequency loss, (B) Temporal loss, (C) Frequency loss, (D) Spatial loss.

