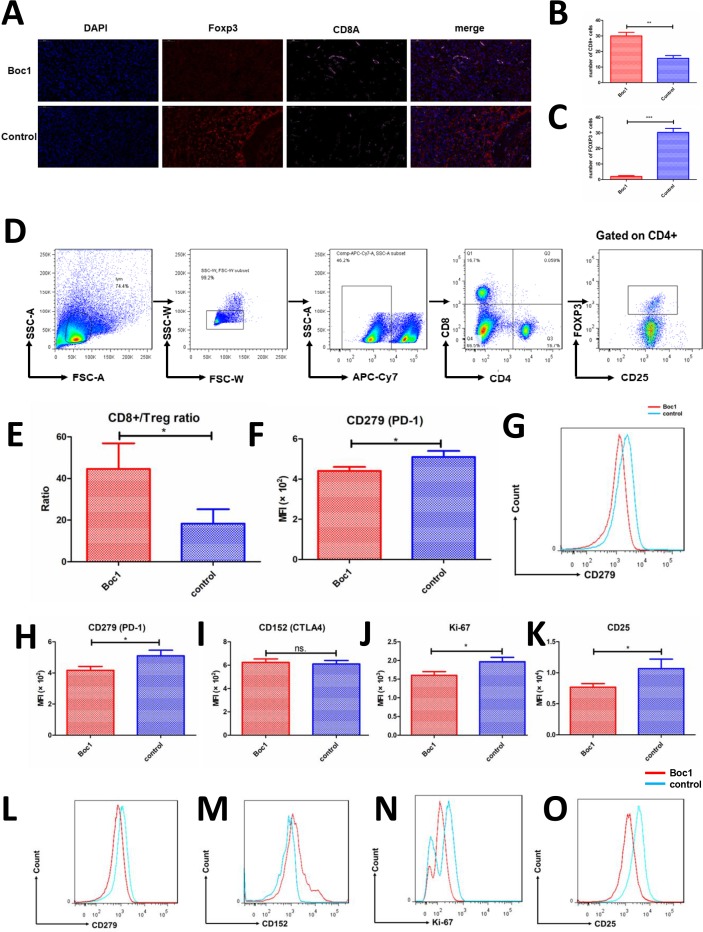
Figure 6.
ANXA1 blocker reduces the infiltration and functions of Treg cells in tumors. (A) Immunofluorescence of mice tumor (nuclear: DAPI, blue; FOXP3: SP-Orange, red; CD8a: Cy5, pink); (B, C) counted under high-power field (×400); each group included three tumors, and five high-power fields were calculated for each tumor; data are presented as mean±SD; (B) number of CD8+ T cells; (C) number of Foxp3+ cells; (D) the gating strategy of choosing CD8+ T cells and Treg cells; (E) the ratio of CD8+ T cells to Treg cells (CD4+CD25+FoxP3+) in the two groups was compared; data are presented as mean±SD (n=3); (F) CD279 expression of CD8+ T cells was measured by flow cytometry; data are presented as mean±SD (n=3); (G) MFI of CD279 was measured by flow cytometry; (H–K) flow cytometry tests of mice tumors; CD279, CD152, Ki-67 and CD25 expression of Treg cells (CD4+CD25+FoxP3+) were measured, respectively; data are presented as mean±SD (n=3); (L–O) MFI of CD279, CD152, Ki-67 and CD25 were measured, respectively. MFI, mean fluorescence intensity. *p<0.05, **p<0.01, ***p<0.001 as determined by Student’s t-test.

