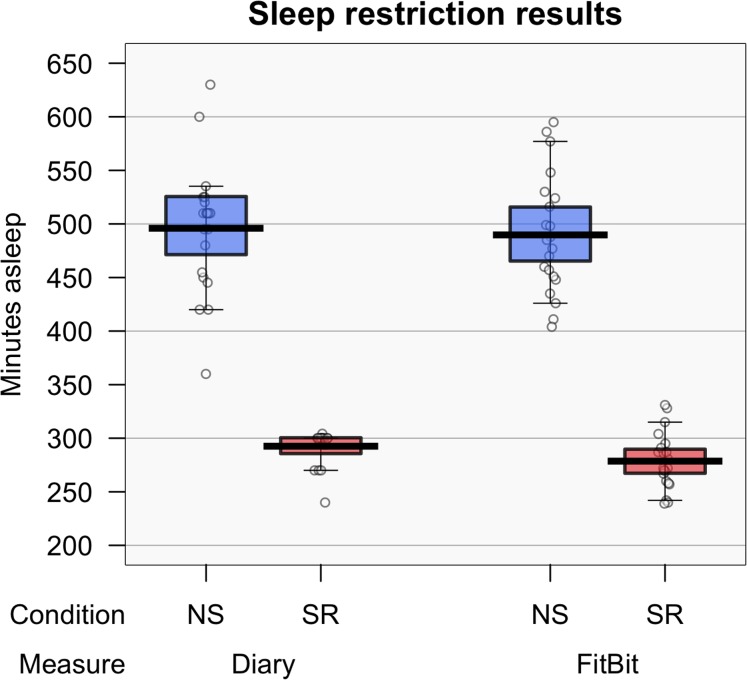
Figure 3. Experiment 2: sleep data.
Recorded hours of sleep according to the FitBit® and sleep diary (left) and subjective sleepiness (right). Means are shown by black horizontal bars. Individual scores are represented by black circles, slightly jittered for clarity; coloured areas represent 95% Highest Density Intervals (HDIs), calculated using R’s BEST (Bayesian Estimation Supersedes the t-Test) package, and vertical bars represent the 10th and 90th quantiles.

