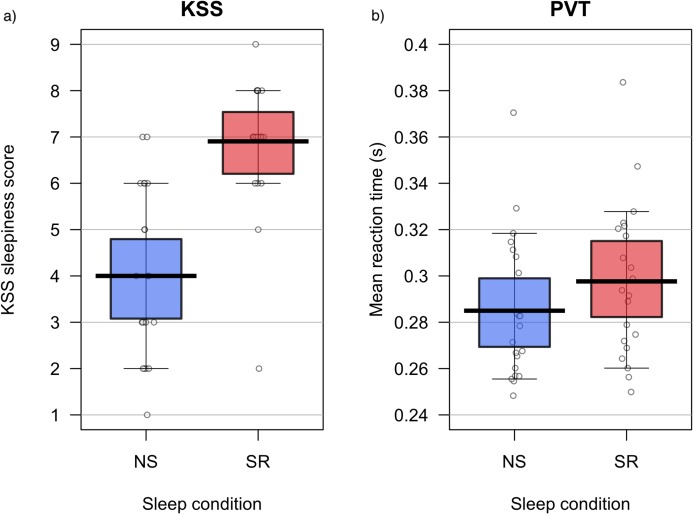
Figure 4. Experiment 2: KSS data and PVT performance.
Karolinska Sleepiness Scale ratings (A) and PVT performance (B) during normal sleep (NS) and sleep restriction (SR). Means are shown by black horizontal bars. Individual scores are represented by black circles, slightly jittered for clarity; coloured areas represent 95% Highest Density Intervals (HDIs), calculated using R’s BEST (Bayesian Estimation Supersedes the t-Test) package, and vertical bars represent the 10th and 90th quantiles.

