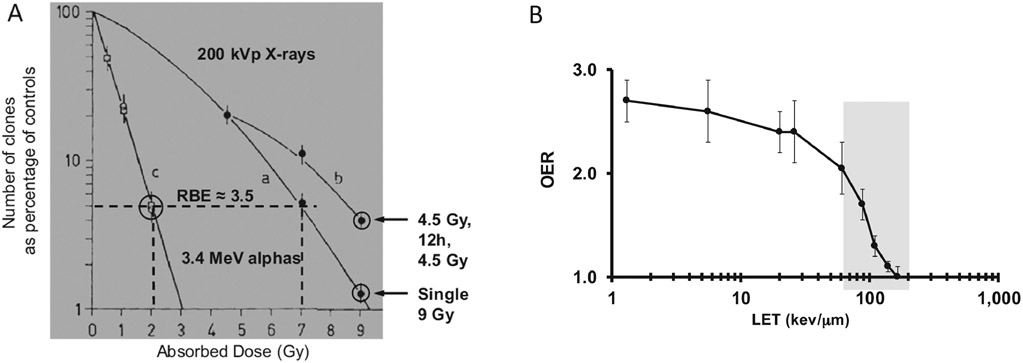
Figure 4.
Illustration of the biological effects associated with α-particles due to their high LET. A. Cell survival curve for T1 cells irradiated with 200 kVp X-rays (curves a and b) and alpha-particles from 210Po (curve c). The figure shows an RBE of approximately 3.5 for 4% cellular survival for these two radiation types. The figure also shows increased survival (curve b) when a 12 h delay is introduced between 2 4.5 Gy fractions compared to the survival associated with a single 9 Gy irradiation. Cell survival remained unchanged when a 12h delay between alphabeam irradiation was introduced (two encircled data points at 2 Gy for curve c). B. The oxygen enhancement ratio (OER), defined as the absorbed dose ratio required to achieve the same level of cell kill for cells irradiated under different oxygen conentrations. The plot shows that the absorbed dose delivered must be increased by a factor of 2.5 to 3 for low LET radiations. In the range of LET values for α-particles the factor needed depends on LET and ranges from approximately 2 to 1 (where OER=1 means no hypoxia-induced radioresistance). Figures adapted from references [10] and [1].

