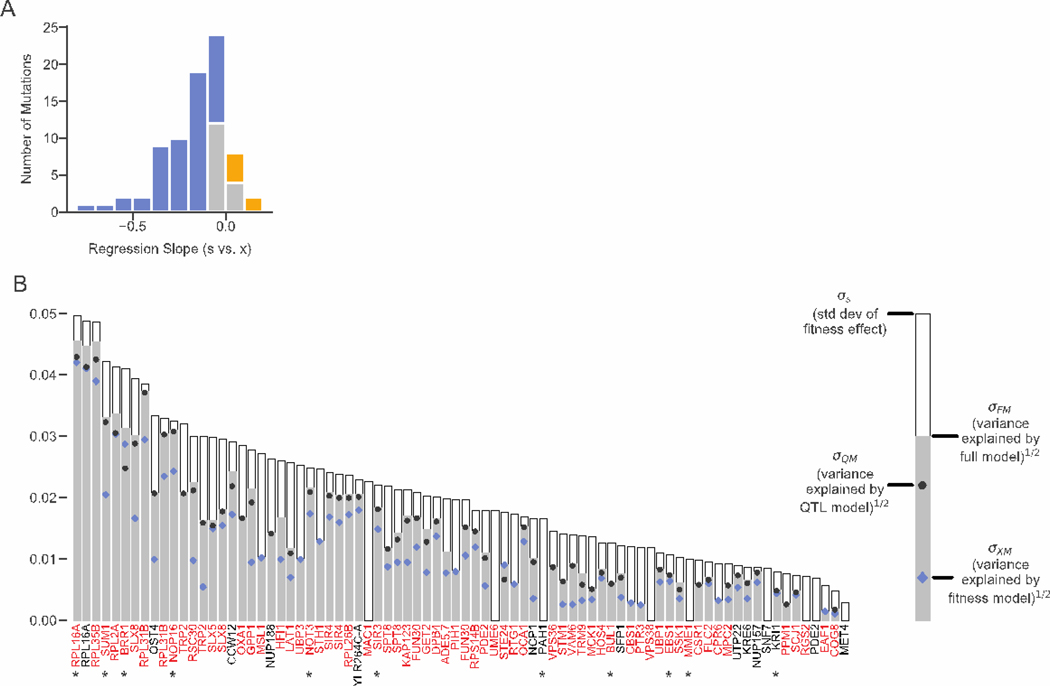
Figure 4. Genetic determinants of fitness effects.
(A) Histogram of regression slopes between fitness effect and background fitness for each mutation. Significant negative and positive correlations are shown in blue and yellow, respectively. (B) For each mutation, the standard deviation of fitness effect across segregants and the square root of the variance explained by each of the three models. For each mutation, the variance explained by models that were not significantly better than a no-epistasis model are not plotted. Mutations shown in red or black are insertions in or near the corresponding gene respectively; stars indicate the mutations shown in Figure 3. Only mutations with fitness effect measurements in at least fifty segregants are shown.

