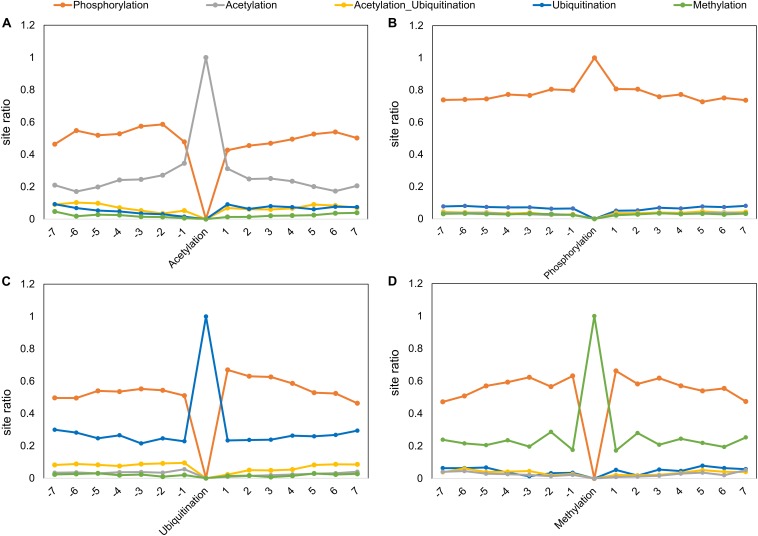
FIGURE 5.
Post-translational modification motifs and occurrence of other PTMs or combination around (A) Acetylation, (B) phosphorylation, (C) ubiquitination, and (D) methylation. The x-axis represents the site position in the motif. The y-axis represents the ratio of sites with respect to the total sites for a particular PTM.

