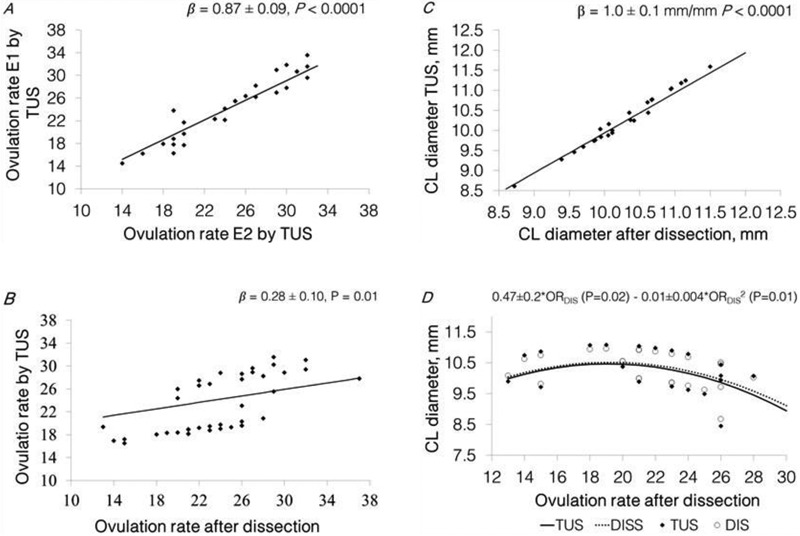
Figure 2.

Panel A, predicted relationship between OR assessed by TUS performed by examiner 2 and the OR assessed by TUS performed by examiner 1 [(n = 29), β = 0.87 ± 0.09 CLTUS E1/CLTUS E2, P < 0.0001, farm P = 0.12]. Panel B, predicted relationship between the OR assessed by E1 by TUS and OR after dissection [β = 0.28 ± 0.01 TUS/DIS, P = 0.01, farm P = 0.0002, (n = 45)]. Panel C; predicted relationship between the average diameter of the 10 biggest CL assessed after ovarian dissection and the average diameter of the 10 biggest CL assessed by TUS [(n = 25), β = 1.0 ± 0.07 mm TUS/mm dissected, P < 0.0001]. Panel D, predicted relationship between the OR after dissection and the average CL diameter [TUS = 0.49 ± 0.19 (P = 0.02) – 0.01 ± 0.005 (P = 0.01) and DISS = 0.47 ± 0.18 (P = 0.02) – 0.01 ± 0.004 (P = 0.01)]. Statistical models included the fixed class effect of farm (n = 2, for panels a and b), and the random effect of batch (n = 6). Data points (♦) represent the predicted values estimated as the difference with the model residuals.
