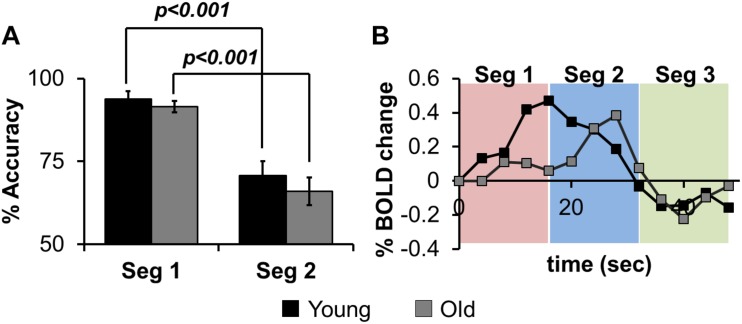
FIGURE 2.
(A) the% accuracy of in-scanner language behavior for both groups (Young, Old) for Seg1 (first 4 words) and Seg2 (last 4 words) (see text for details). (B) group-averaged HRF from left Angular gyrus divided into Seg1 (first 4 words), Seg2 (last 4 words), and Seg3 (post-stimulus BOLD response).

