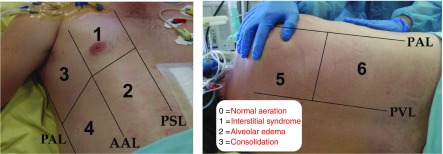
Figure 1.
Lung ultrasound score (LUS) assessment. Six lung regions of interest (numbered in the figure), delineated by a parasternal line, anterior axillary line, posterior axillary line, and paravertebral line, are examined on each side. Each lung region is carefully examined in the longitudinal plane, and each intercostal space present in the region is examined in the transversal plane. The worst ultrasound pattern characterizes the region (regional LUS) using the following grading: 0 = normal aeration; 1 = moderate loss of aeration (interstitial syndrome, defined by multiple spaced B lines, or localized pulmonary edema, defined by coalescent B lines in less than 50% of the intercostal space examined in the transversal plane, or subpleural consolidations); 2 = severe loss of aeration (alveolar edema, defined by diffused coalescent B lines occupying the whole intercostal space); and 3 = complete loss of lung aeration (lung consolidation defined as a tissue pattern with or without air bronchogram). The LUS is calculated as the sum of the 12 regional scores. AAL = anterior axillary line; PAL = posterior axillary line; PSL = parasternal line; PVL = paravertebral line.

