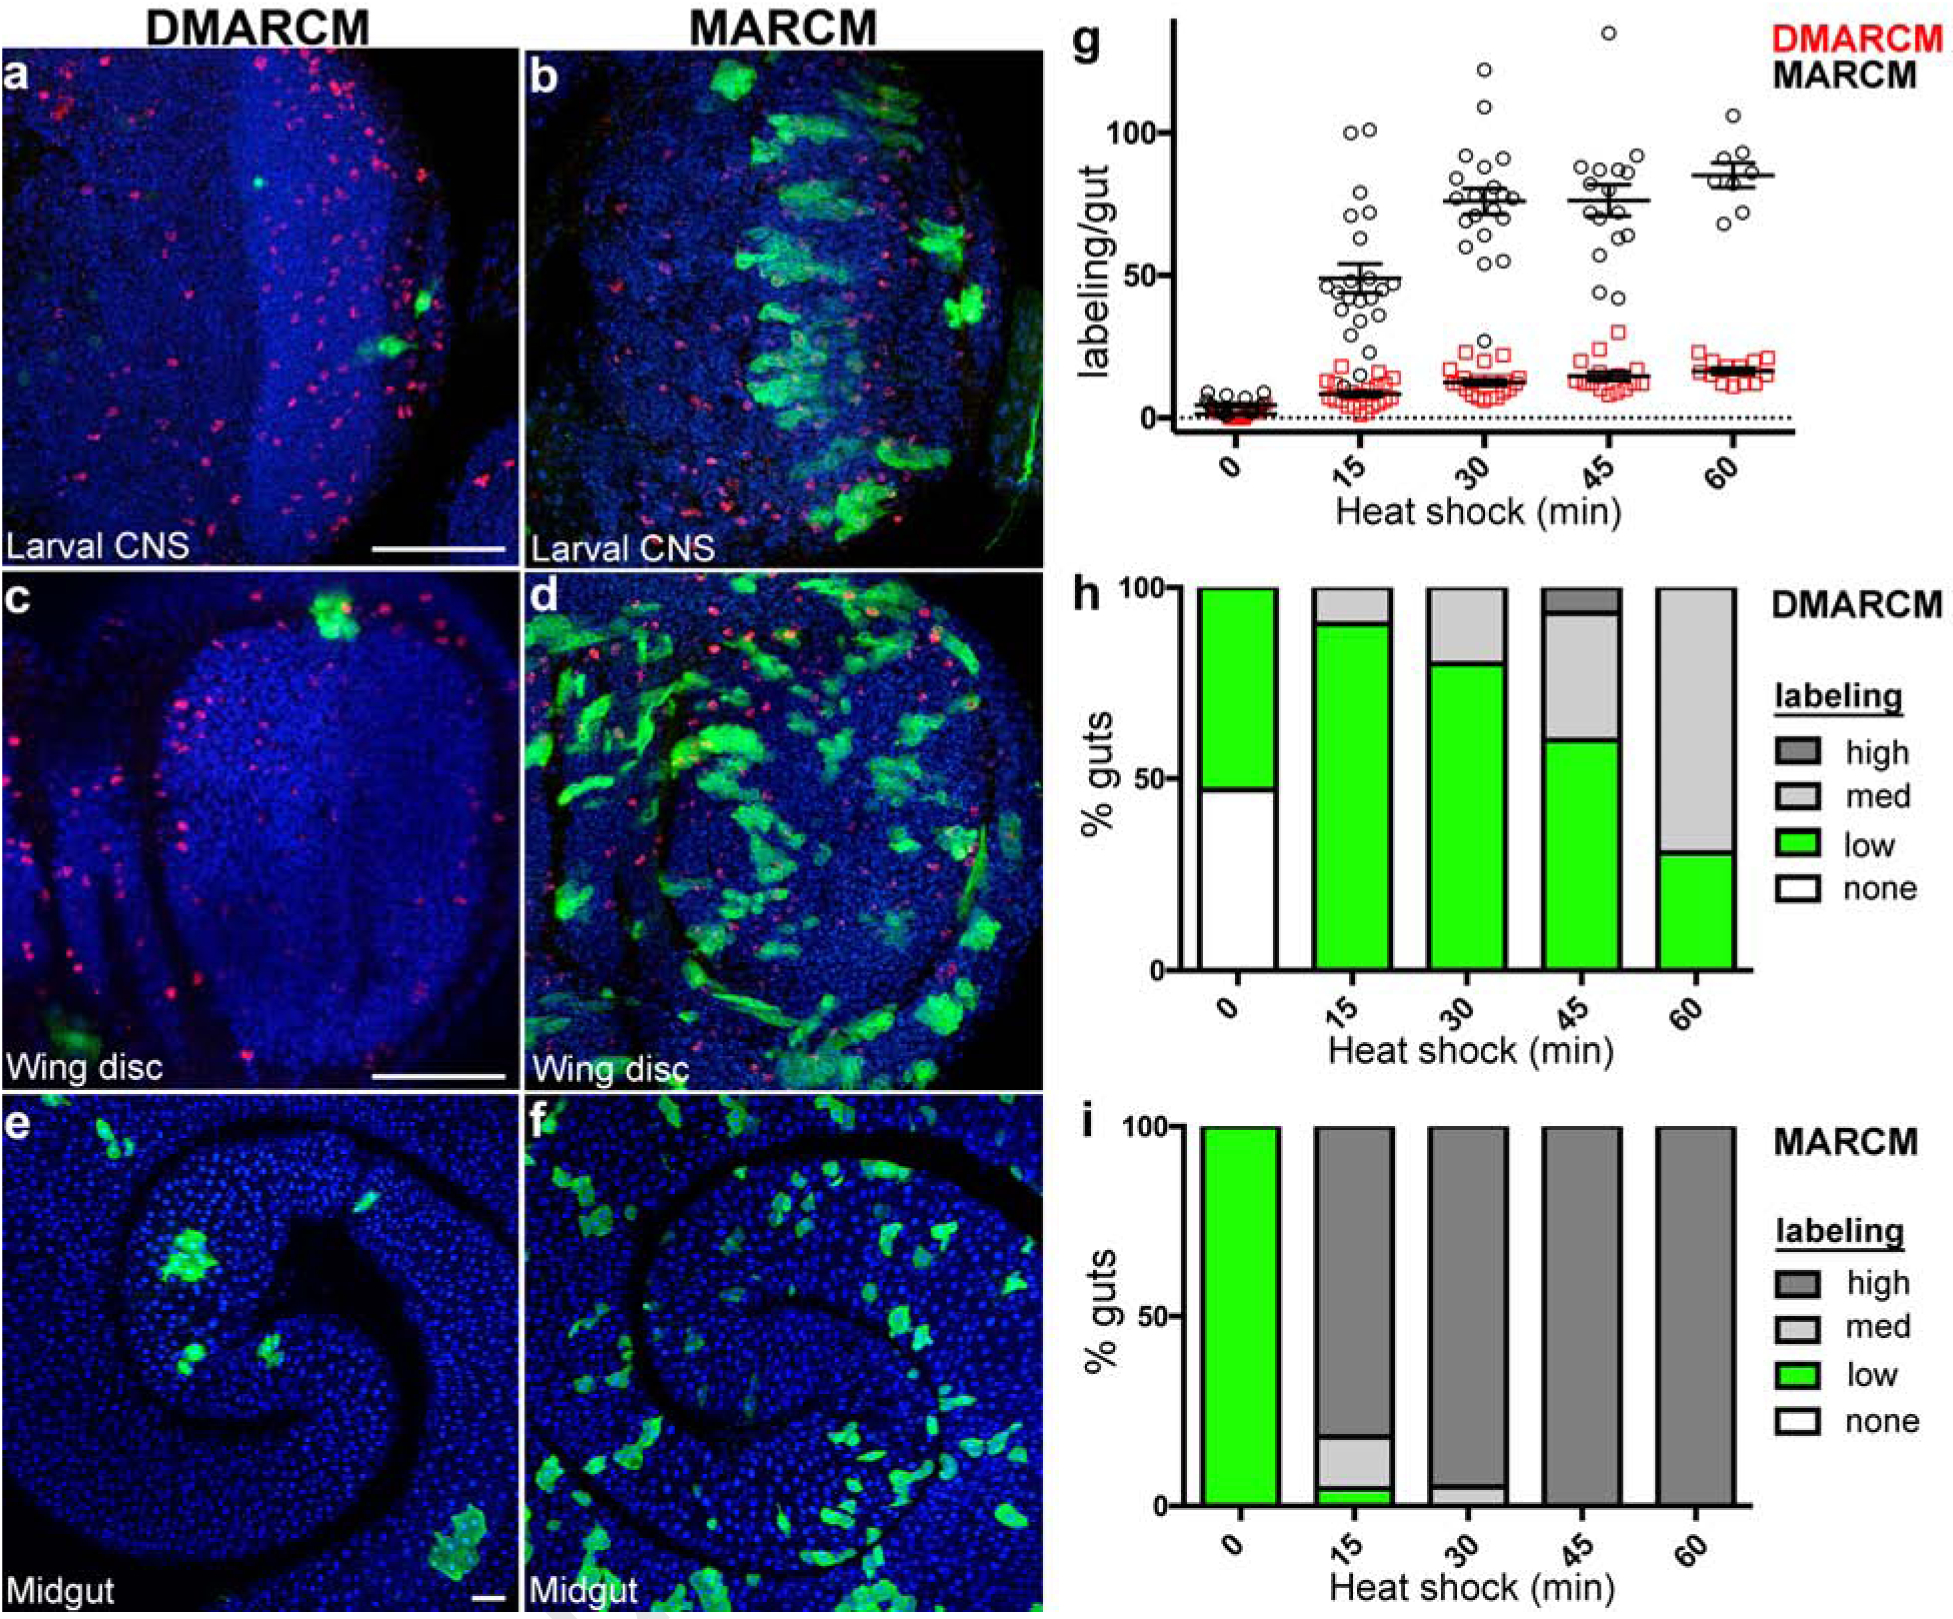
Fig. 2: Ultra-low frequency cell lineage labeling using DMARCM.

a-f, Confocal micrographs of Drosophila tissues imaged following cell labeling (anti-GFP, green; anti-phospho-histone H3, red; DAPI, blue). a, c, e, DMARCM labeling. b, d, f, MARCM labeling. a, b, Optic lobe of the larval central nervous system. c, d, Larval wing imaginal disc. e, f, Adult midgut. Scale bars, 50 μm. g, h, i, Cell labeling present throughout the entire length of adult midgut analyzed 7 days following a single heat shock. Three independent trials were performed, n ≥ 8 guts per treatment group. g, Total GFP positive cell lineage labeling per gut. h, i, Percentage of guts containing the indicated number of GFP positive cell lineages. High, ≥ 30 cell lineages per gut; Medium, 15–30 cell lineages per gut; low, 1–14 cell lineages per gut. h, DMARCM. i, MARCM.
