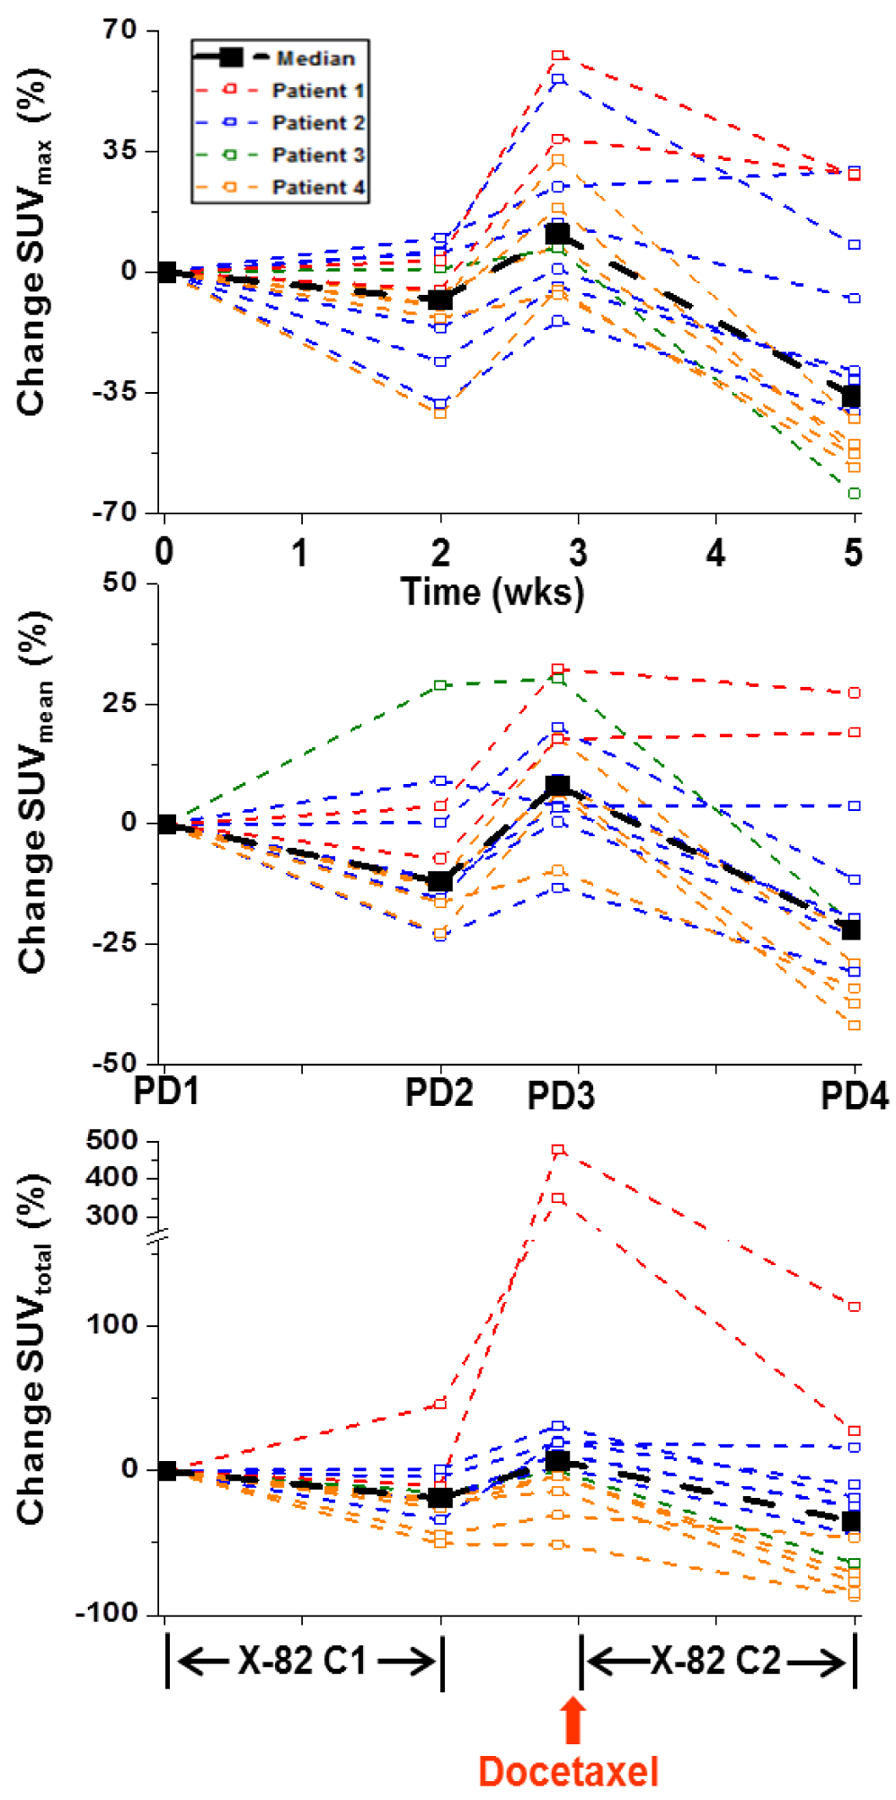
Figure 3:

Percent change in tumor SUVs relative to baseline for SUVmax (top), SUVmean (middle), and SUVtotal (bottom). Tumors from the same patient are shown in the same color. Diminished SUVmax is evident for the majority of tumors during the cycle 1 (C1) and cycle 2 (C2) X-82 exposure periods. Increases in SUVmax are evident for the majority of tumors during the X-82 treatment break. Changes in SUVmean and SUVtotal had similar trends as SUVmax. However, SUVmean was less sensitive to therapy induced changes than SUVmax. SUVtotal was more sensitive than SUVmax to therapy induced changes but the SUVtotal changes demonstrated greater variability across patients than the SUVmax changes.
