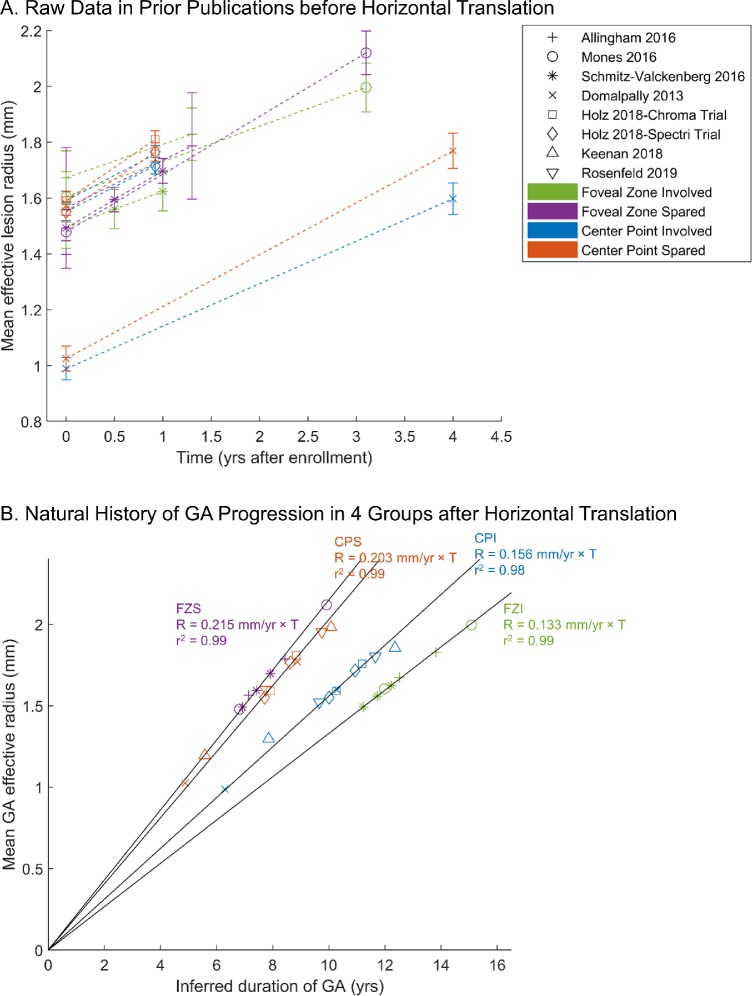
Figure 4.
GA effective radius as a function of time in four GA location groups. The shape of the markers represents the corresponding study, and the color represents one of the four GA location groups. (A) Raw data in prior publications (error bars = standard errors). Note that the initial sizes of GA ranged from 0.99 mm to 1.67 mm in effective radius (3.07–8.79 mm2 in area) among all studies, suggesting that these initial time points represent differing stages of disease. (B) After the introduction of translation factors (expressed in years in Table 1) to correct for different entry times of patients into each clinical study, cumulative datasets in each group fit along a straight line with a very high r2, suggesting that the GA effective radius enlarges linearly over time in each GA location group. In the GA location classification 1, the GA growth rate in the CPS group (0.203 ± 0.013 mm/year) is 30.1% higher than that in the CPI group (0.156 ± 0.011 mm/year). In comparison, the GA growth rate in the FZS group (0.215 ± 0.012 mm/year) is 61.7% higher than the growth rate in the FZI group (0.133 ± 0.009 mm/year) using the GA location classification 2.

