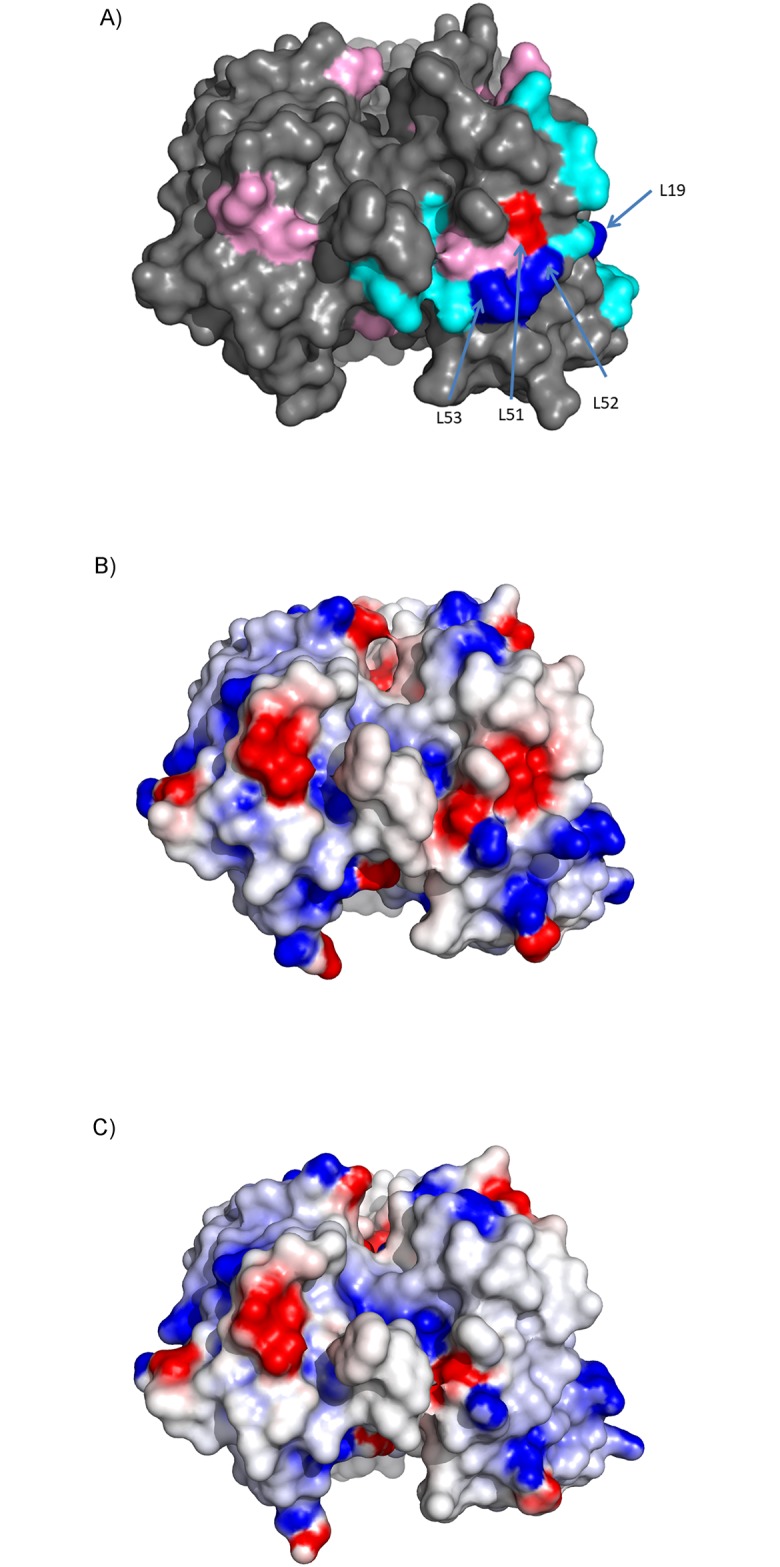
Fig 6. Analysis of the effect of mutations on viscosity.

Two sets of mutations were generated and only a few showed an effect at decreasing the overall viscosity of the antibody. In (A), residues that added a positive charge and reduced viscosity are shown in blue, and those that had no effect or increased the viscosity are shown in light blue. Residues that removed a negative charge and reduced the viscosity are shown in red and those that had no effect or increased the viscosity are shown in magenta. The 4 sites that had the largest effect are all clustered together. All sites are annotated with Kabat positions. As comparison to the parental AB-001 and round 2 parental R2-001, (B) shows the electrostatic potential energy surface of clone R2-006 which had reduced viscosity with maintained activity and (C) shows the electrostatic potential energy surface of R2-020 which has reduced viscosity with 3X loss of activity.
