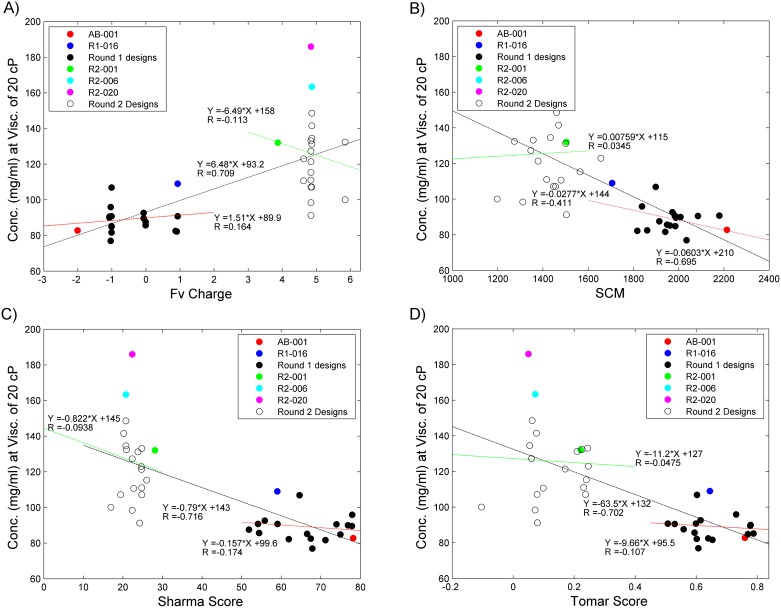
Fig 7. Analysis of charge-based prediction of viscosity.
The concentrations where the viscosity reaches 20 cP of the round 1 and round 2 mutants are plotted against the (a) Fv-Charge, (b) SCM method, (c) Sharma Score and (d) Tomar Score. For each of these AB-001 is shown in red, R1-016 is in blue, the remaining round 1 designs in filled black circles, R2-001 in green, R2-006 in cyan, R2-020 in magenta and the remaining Round 2 designs are in empty black circles. The linear fit lines are shown on the charts along with the correlation value. Round 1 linear fit is shown as a red dashed line, Round 2 linear fit as a green dashed line and the overall linear fit is shown as a black dashed line.

